MetaPR2
A database of metabarcodes
Daniel Vaulot
2023-01-17
![]()
![]()
![]()
Metabarcoding
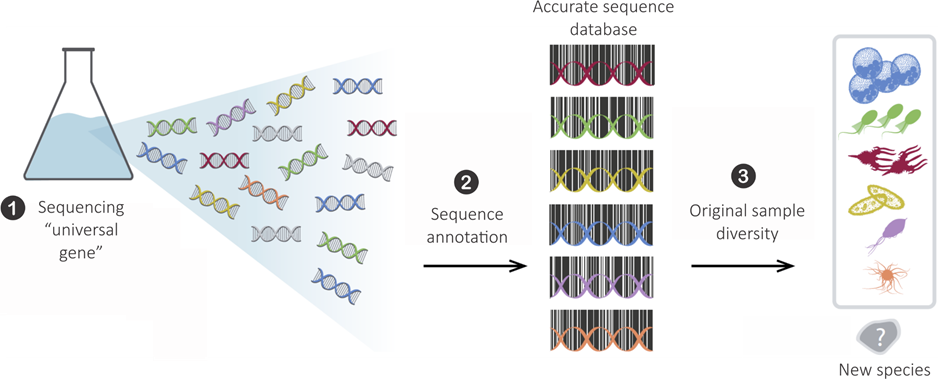
Metabarcoding
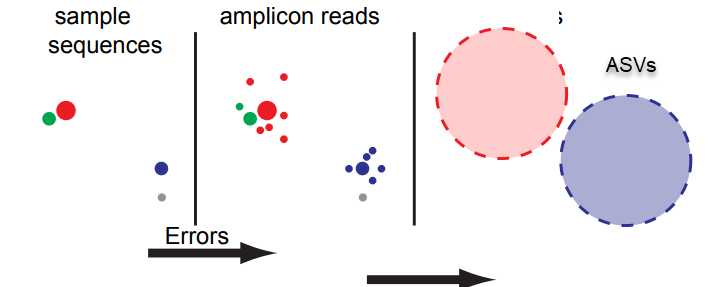
Metabarcoding
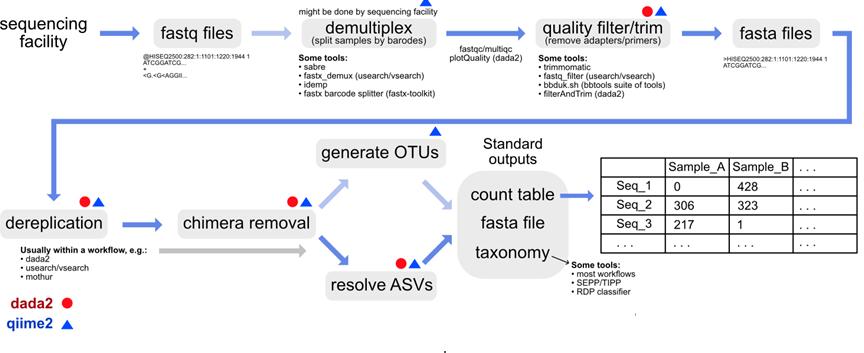
Metabarcoding
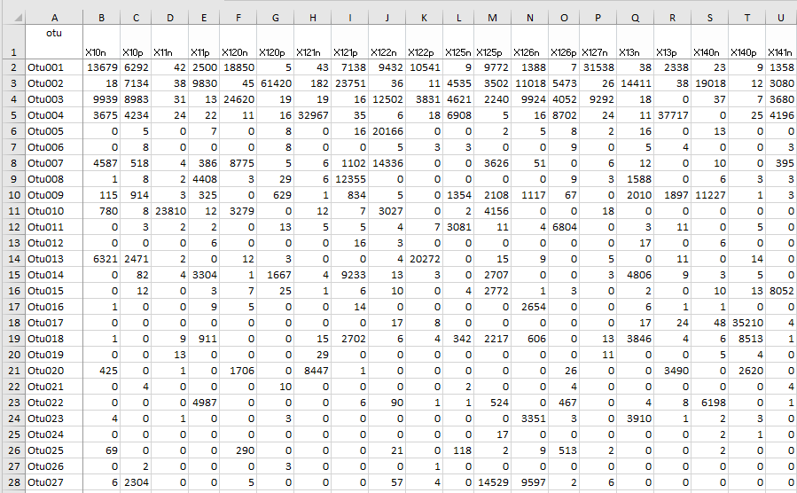
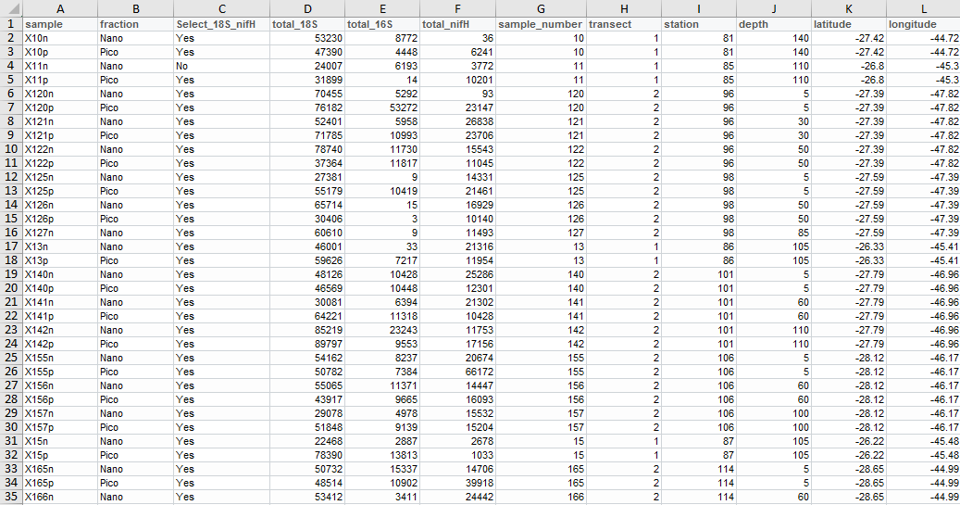
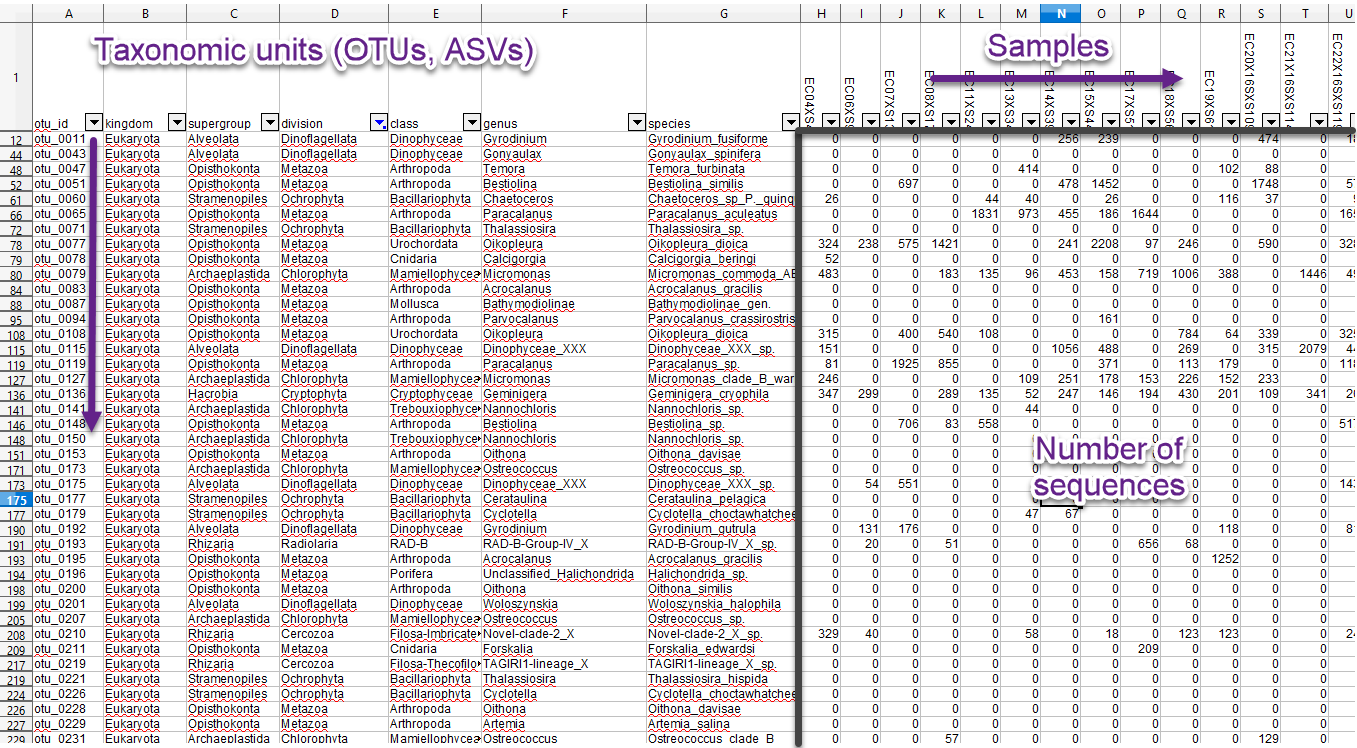
Data tables
Factors affecting protist communities
Environmental conditions
In oceanic waters:
- temperature
- salinity
- light
- nutrients
… which depend on:
- substrate (water vs.ice)
- latitude
- time of the year
- depth
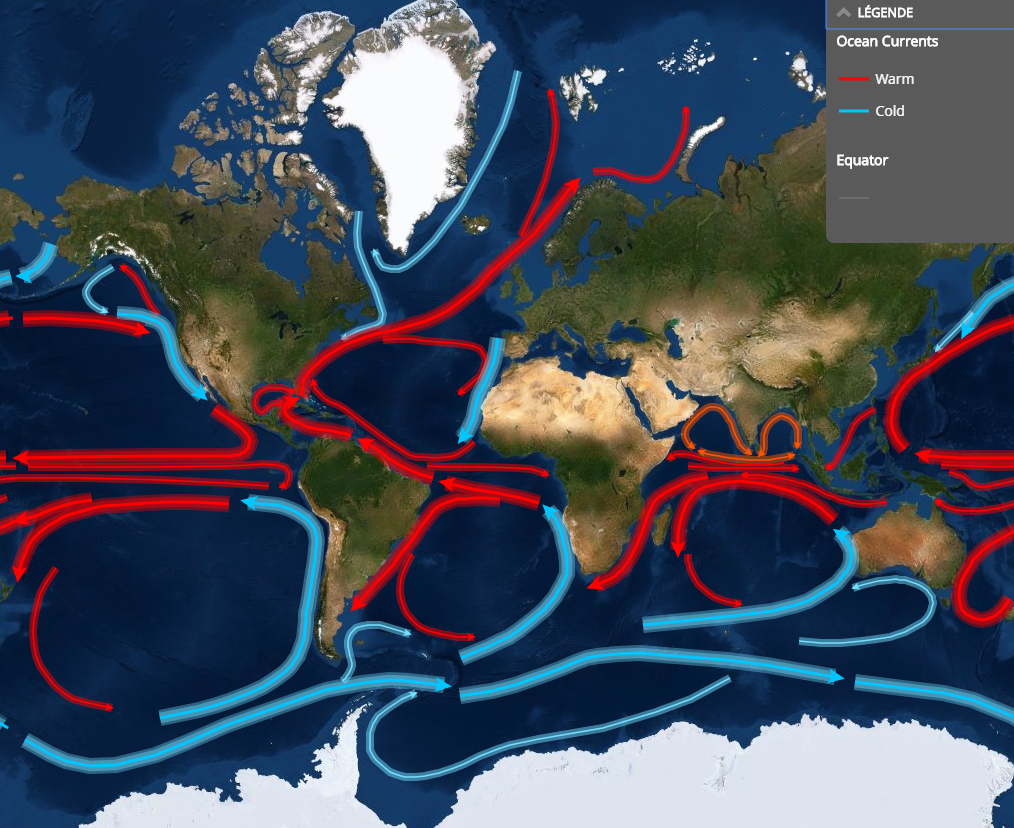
- oceanic currents
- proximity of coast
Diversity
Microbial species in a sample
- species richness: total number of species
- species abundance: proportion of each species
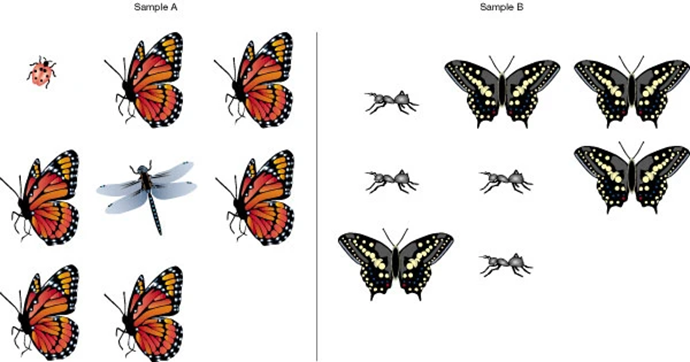
Richness vs. Evenness
Diversity
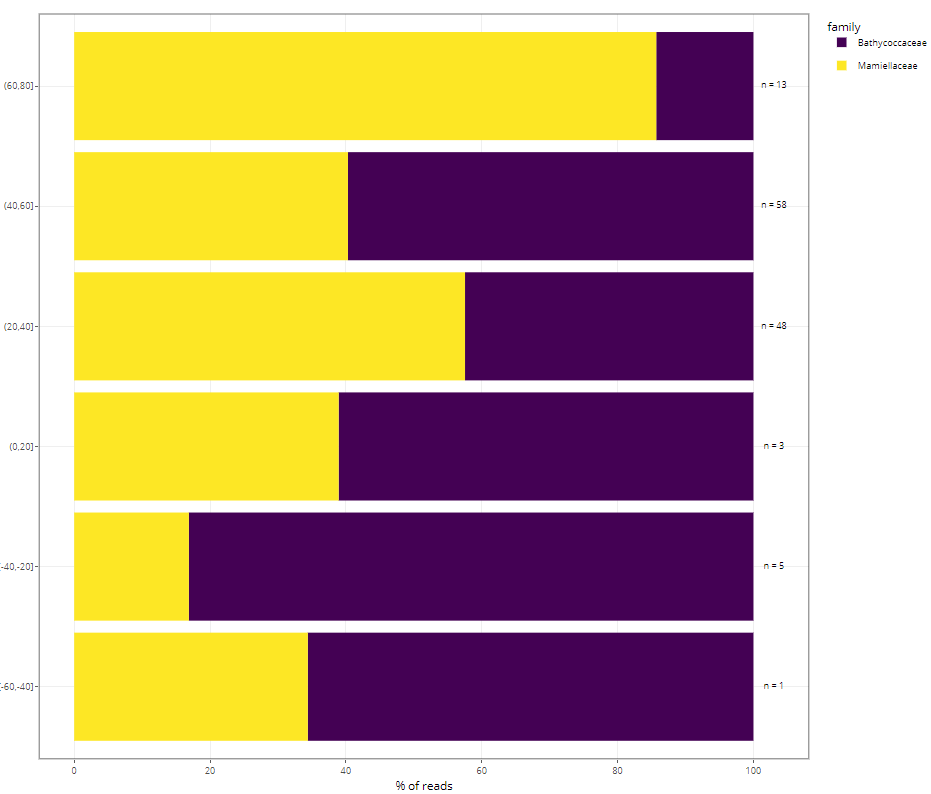
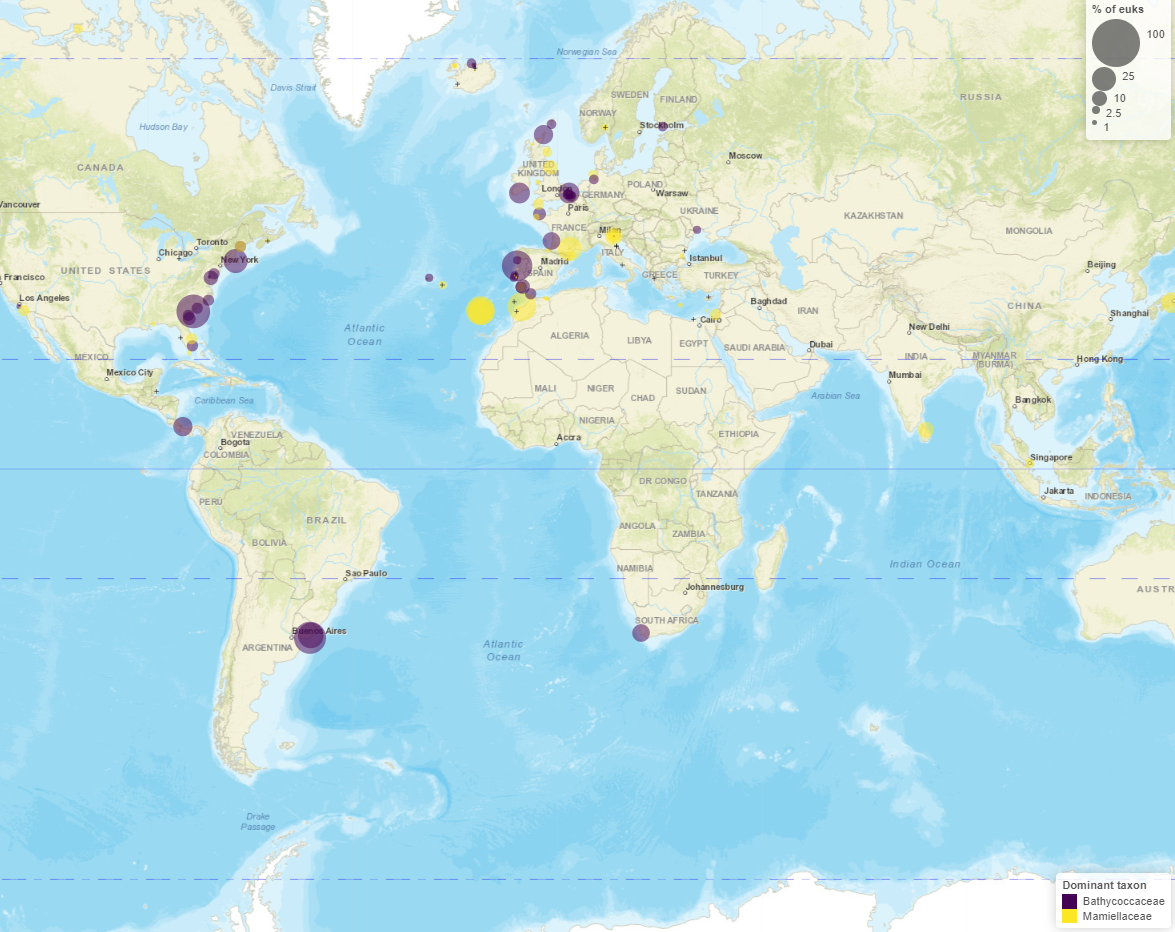
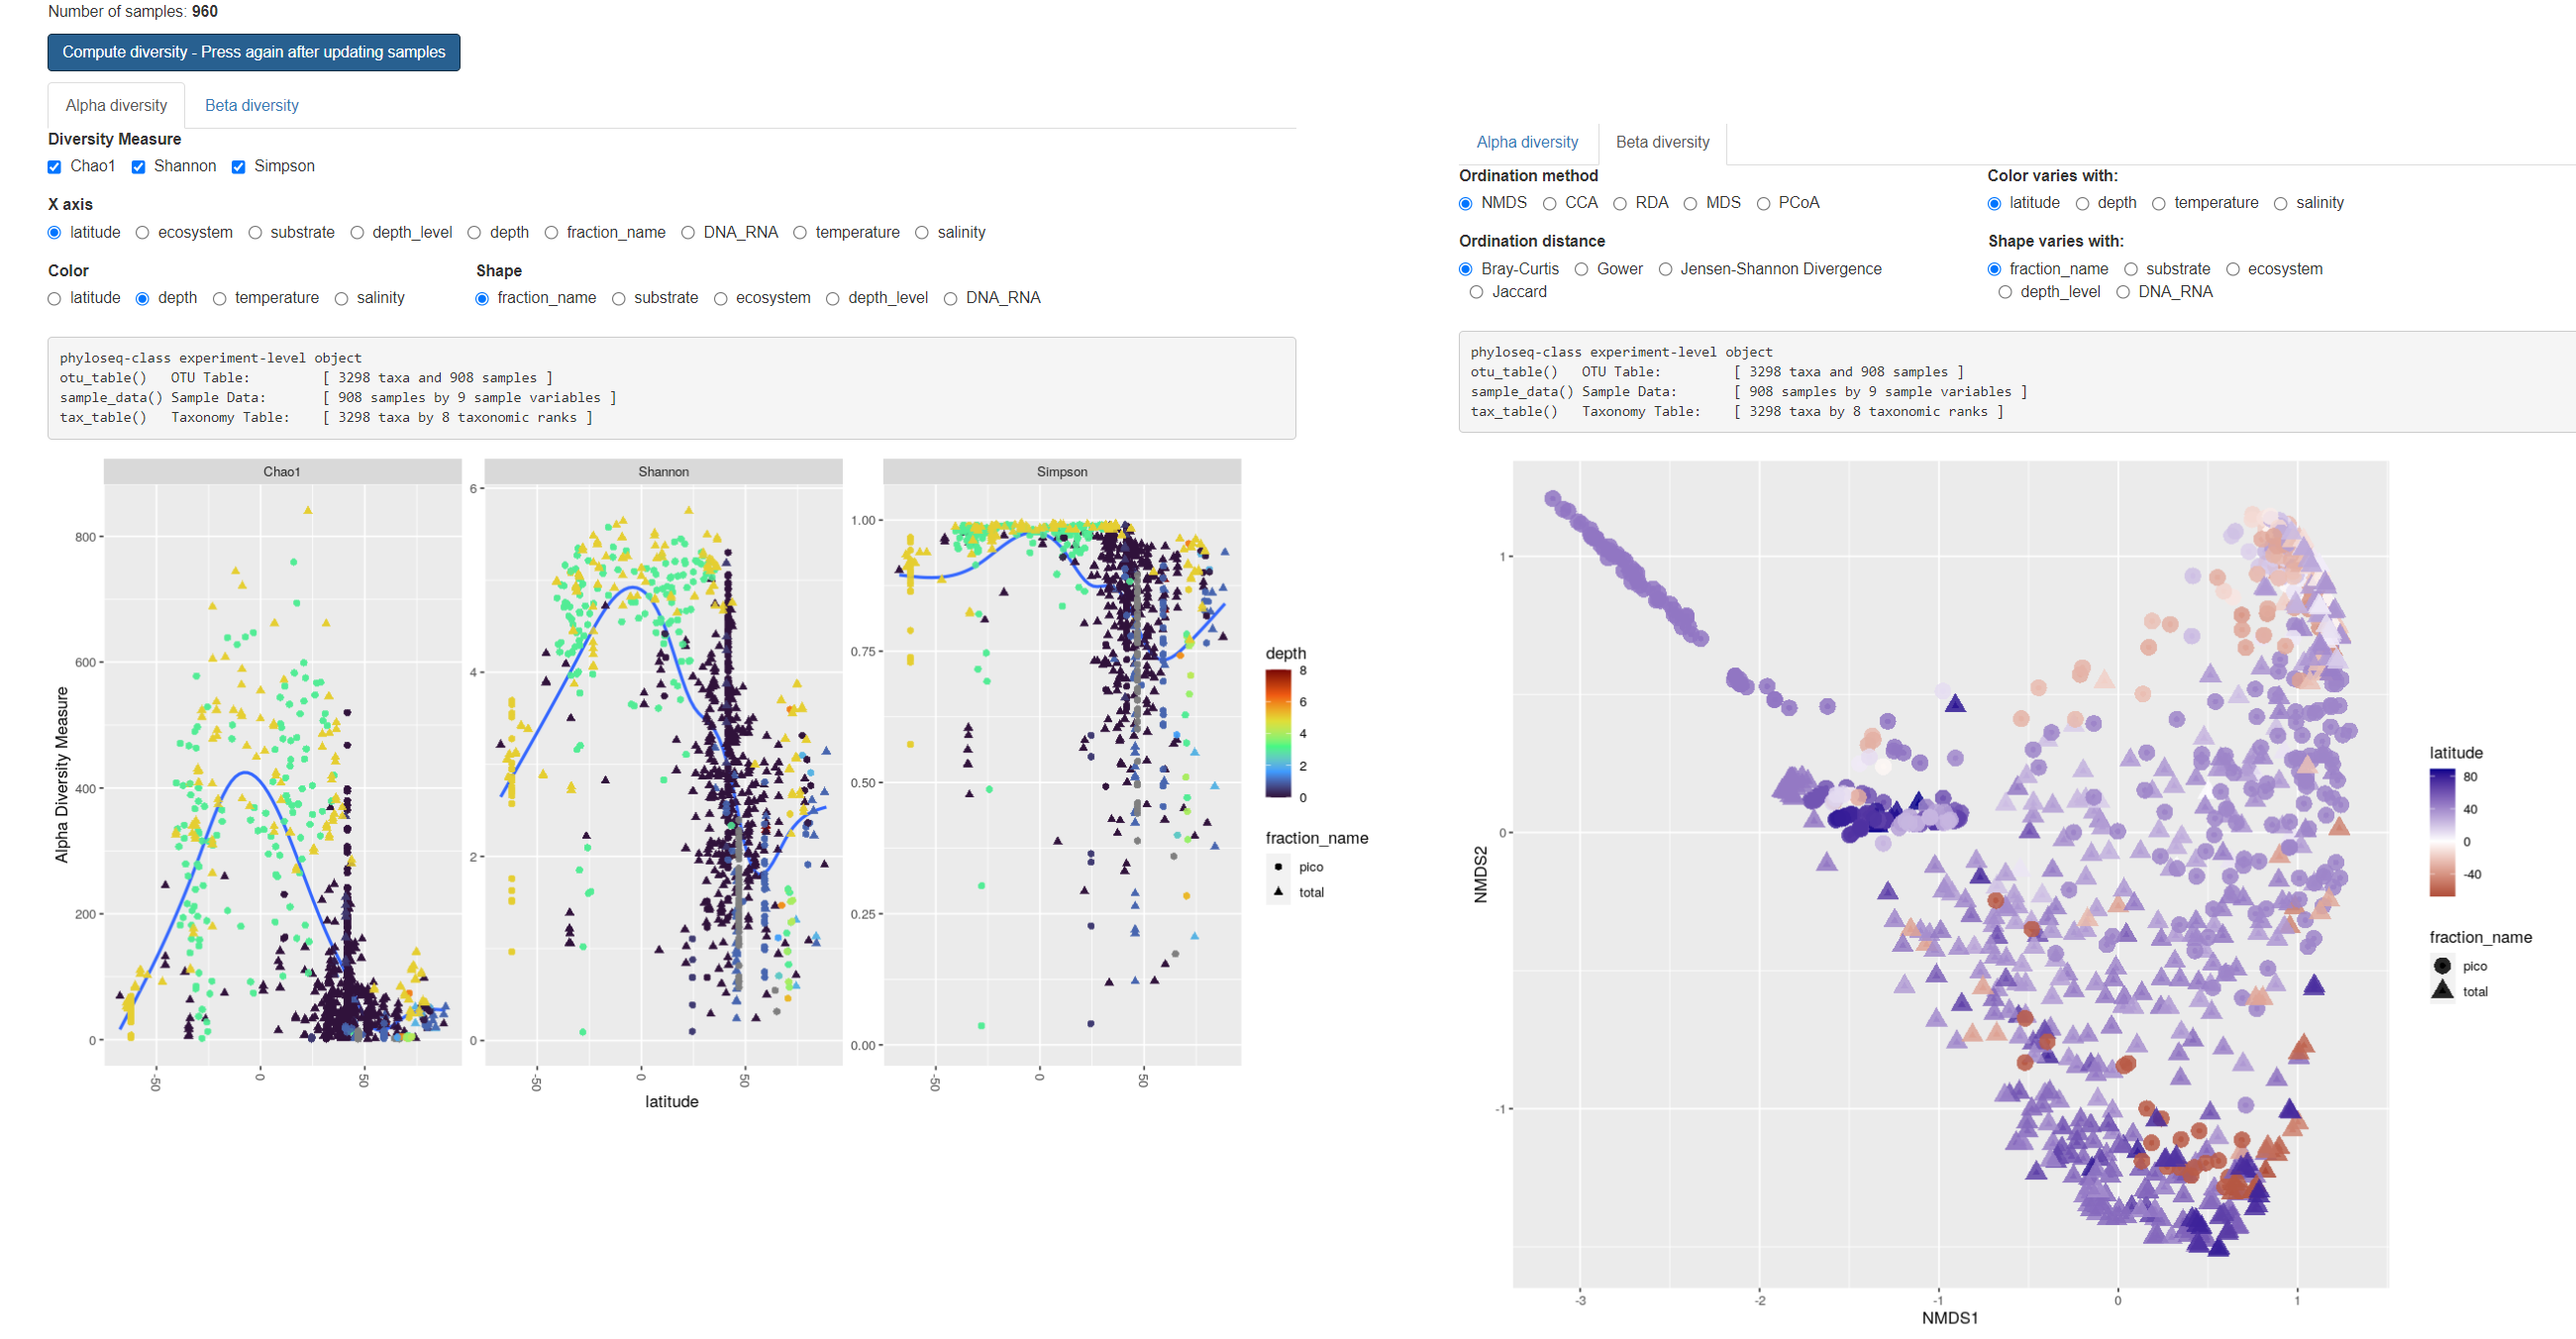
Alpha diversity - Effect of latitude
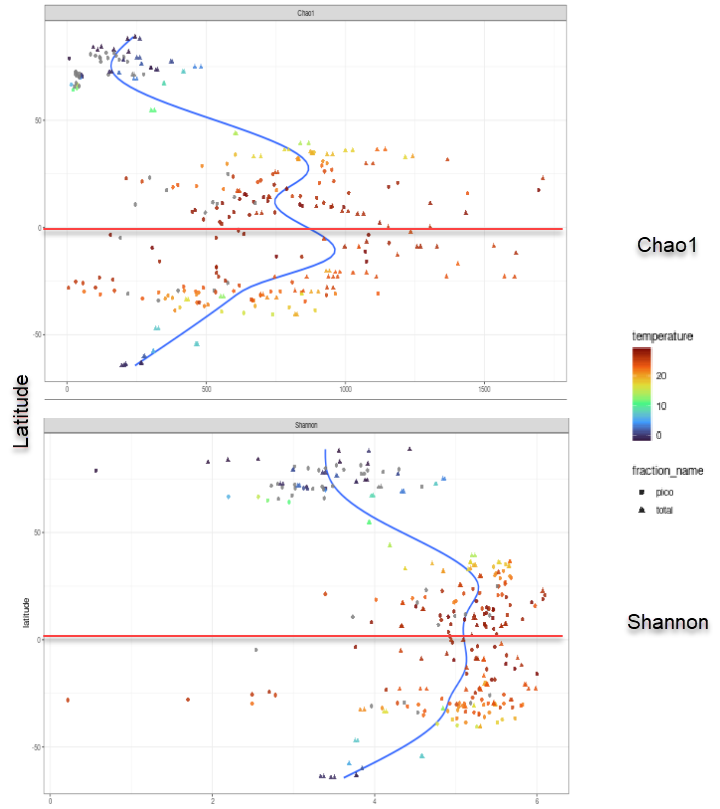
Diversity
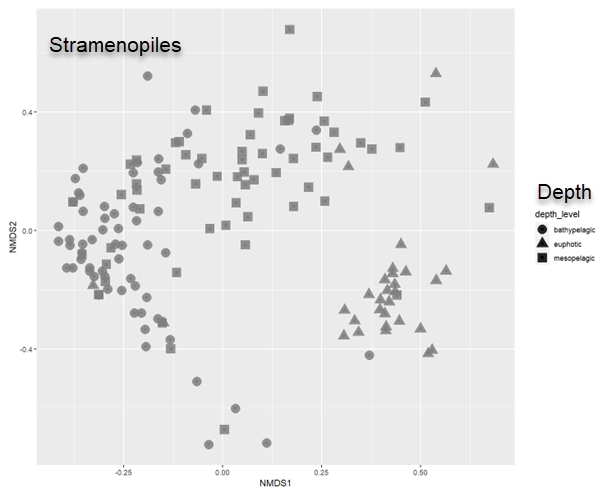
Beta diversity - Effect of depth on Stramenopiles communities
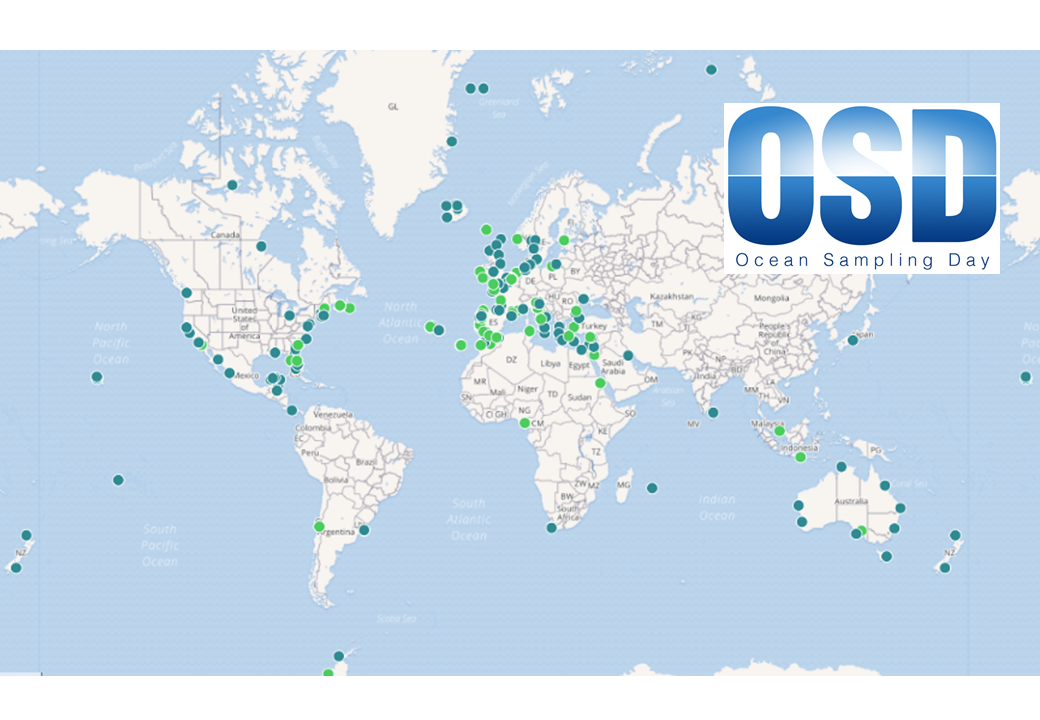
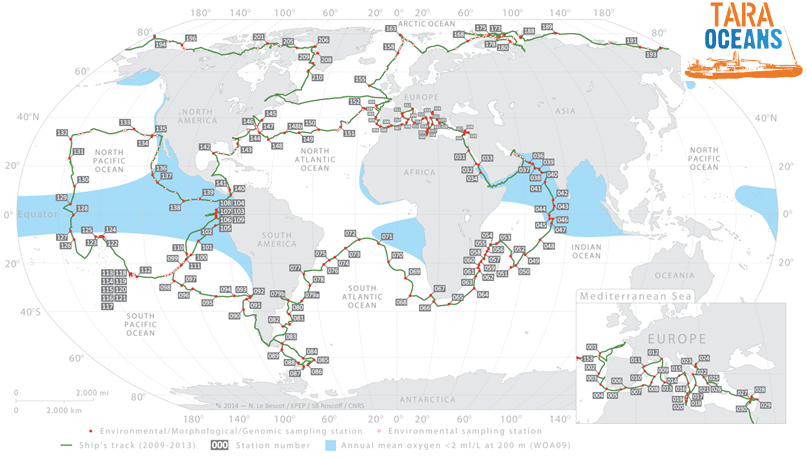
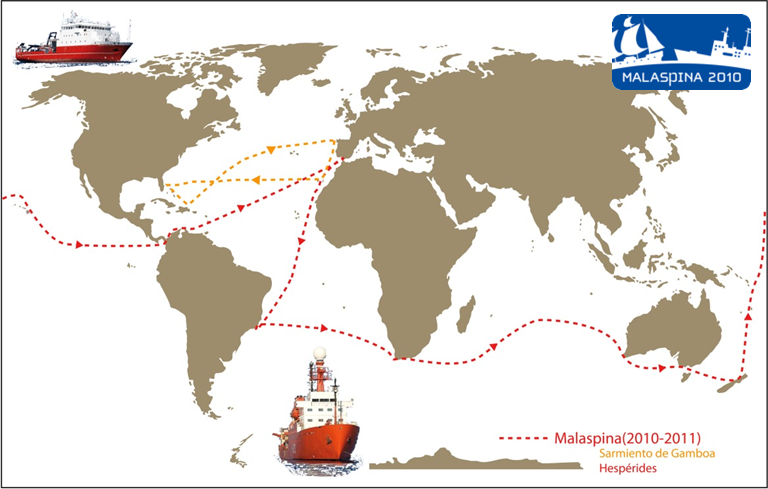
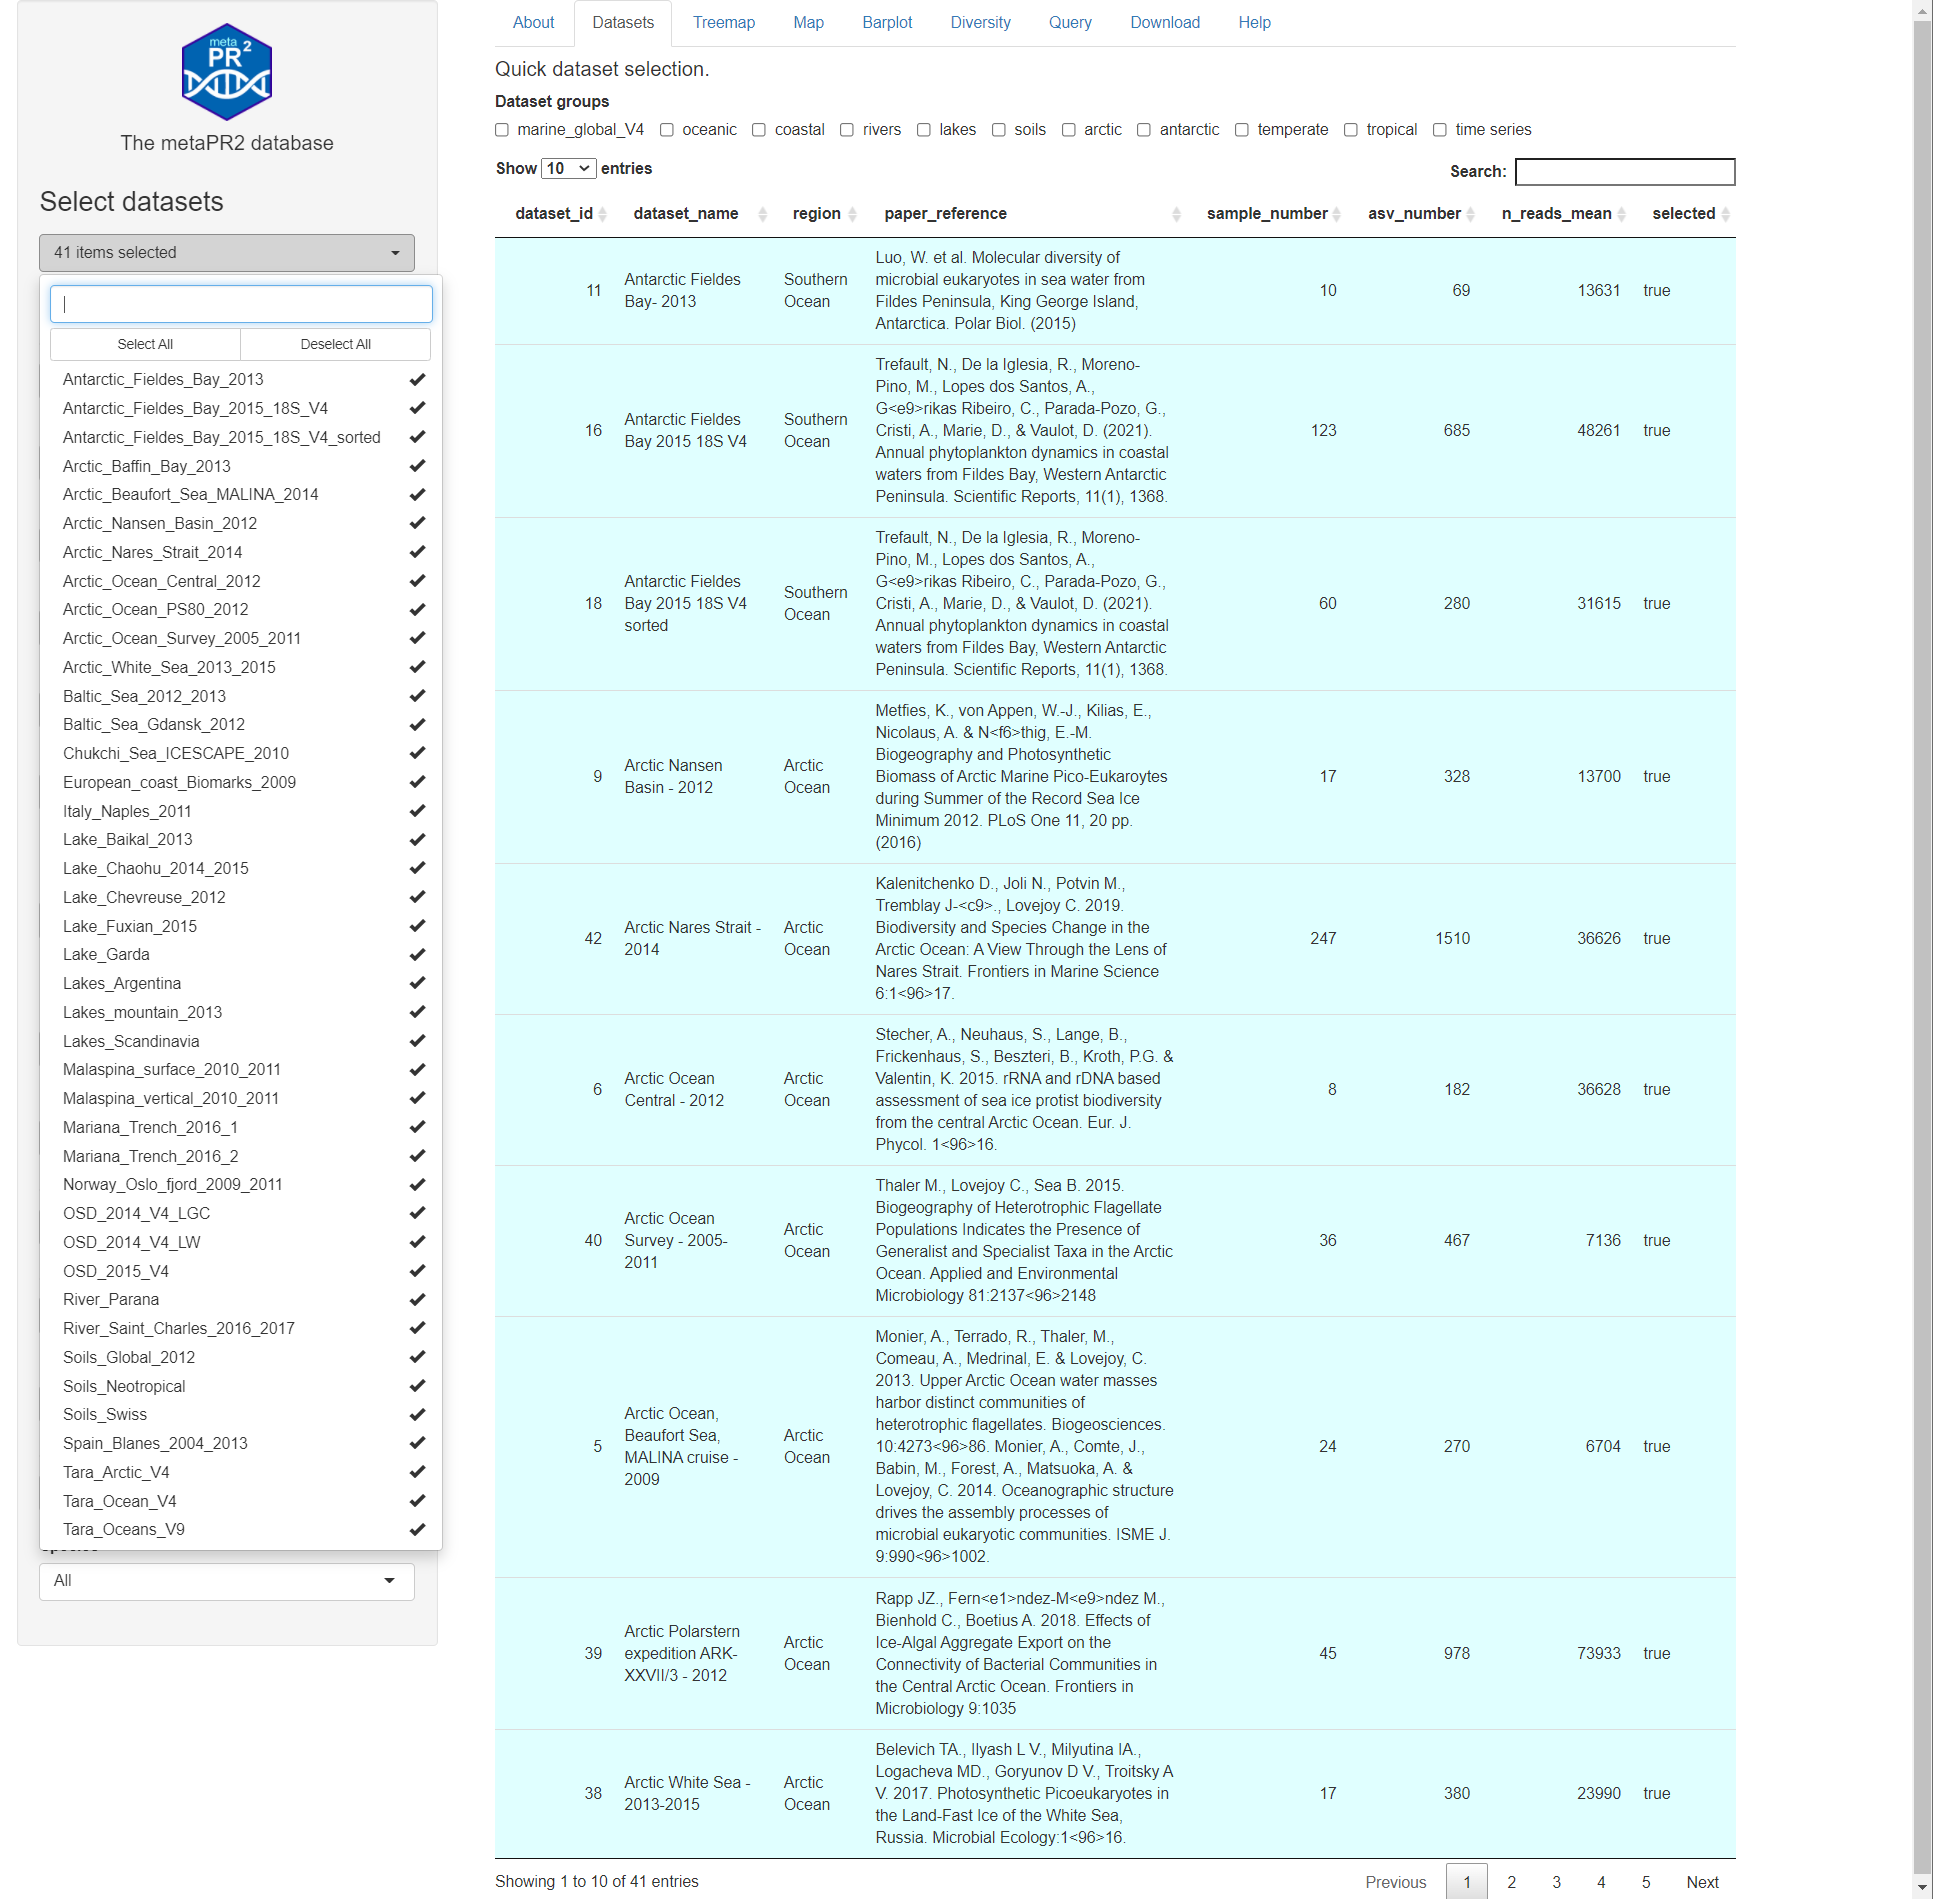
MetaPR2 - Datasets
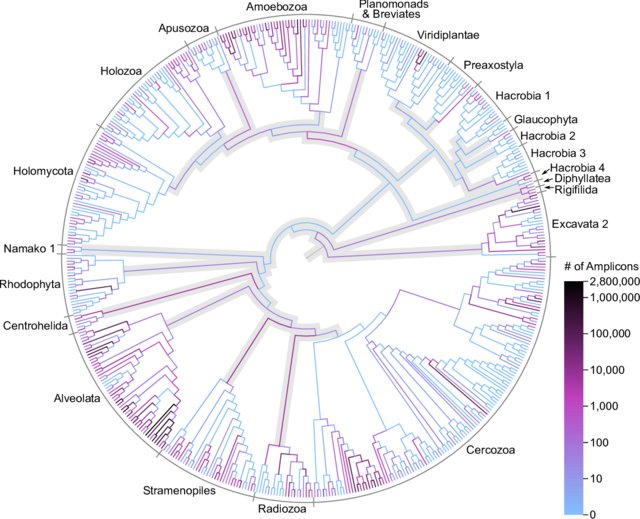
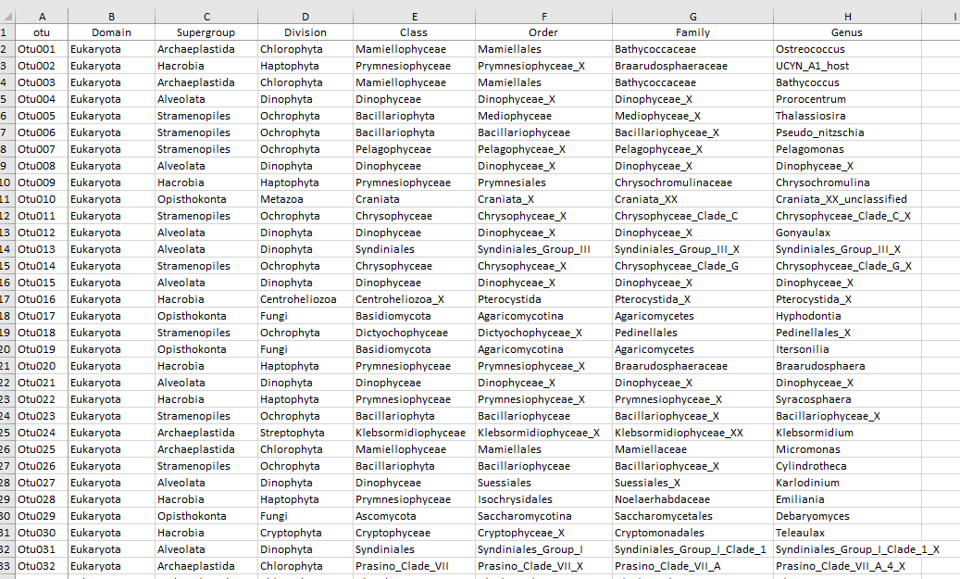
MetaPR2 - Taxonomy
Eight levels:
- Kingdom: Eukaryota
- Supergroup: Archaeplastida
- Division: Chlorophyta
- Class: Mamiellophyceae
- Order: Mamielliales
- Family: Bathycoccaceae
- Genus: Bathycococcus
- Species: B. prasinos
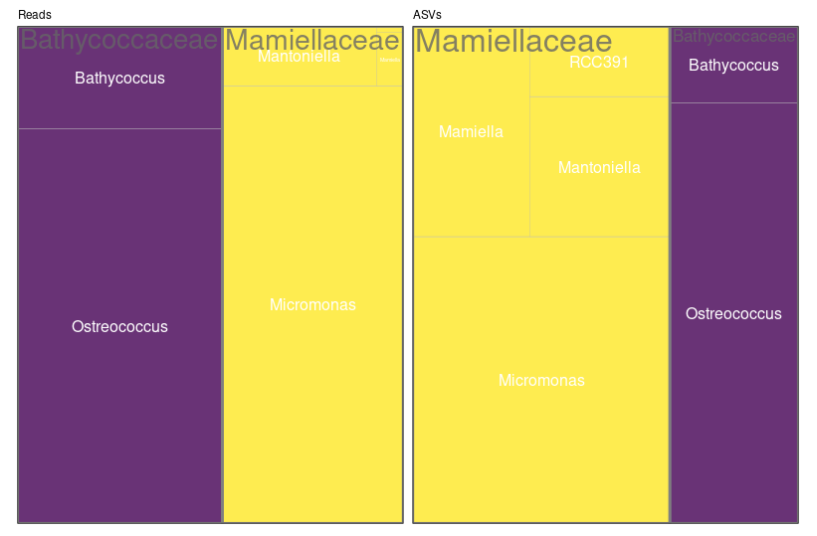
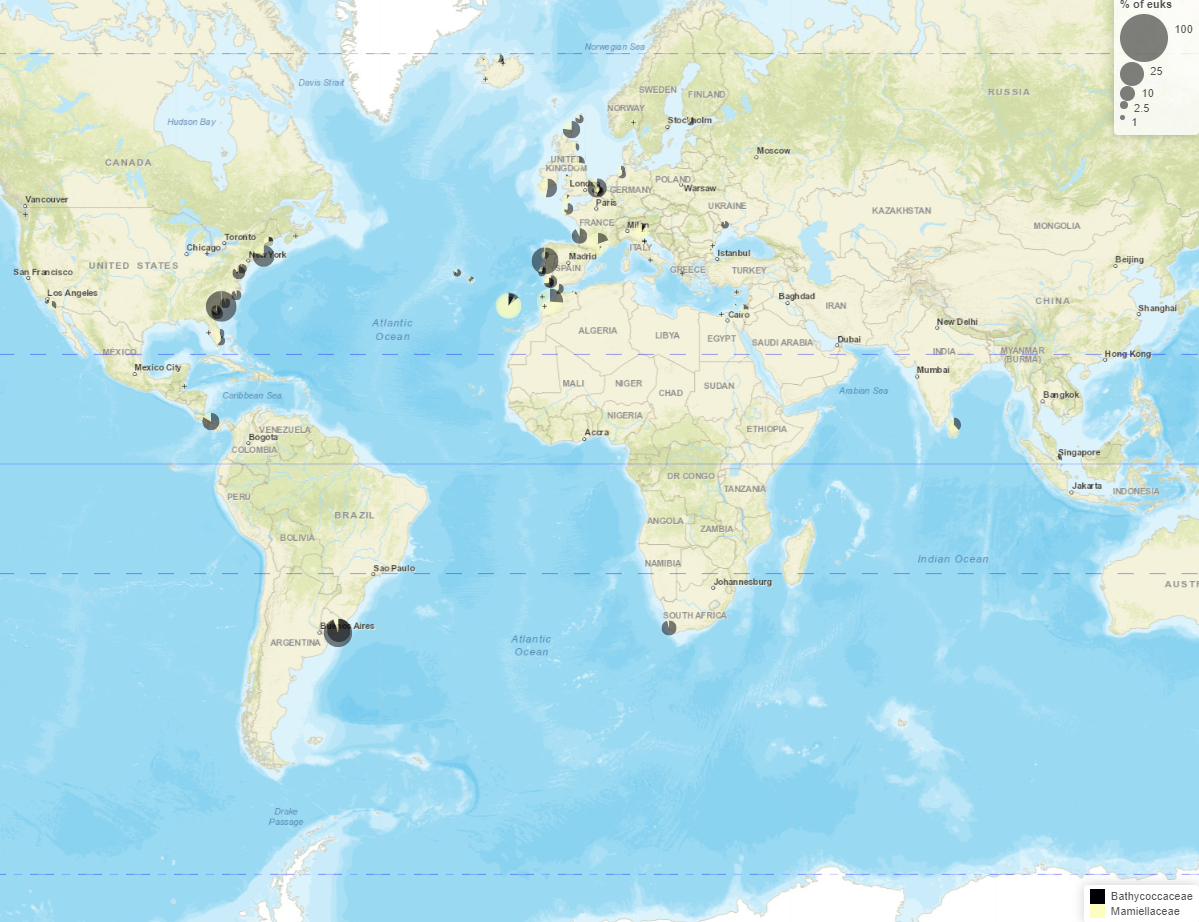
MetaPR2 - Visualization
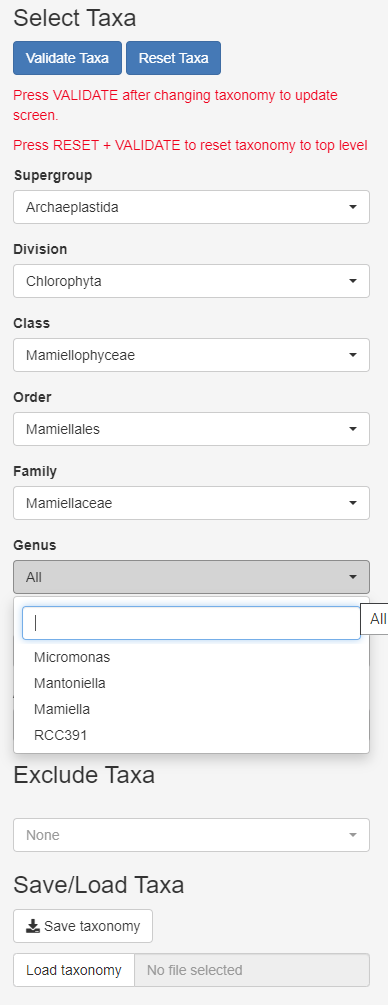
MetaPR2 - In practice
Taxonomy
- Can select several taxa within one level
- Press validate every time you need to refresh
- Can exclude taxa to remove fungi, metazoa…
- Can save taxonomy and reload taxonomy (yaml file)
Final presentation
Taxonomic groups
Green algae
- Prasinoderma
- Ostreococcus
Ochrophyta (Stramenopiles)
- Pelagomonas, Aureococcus
- Florenciella
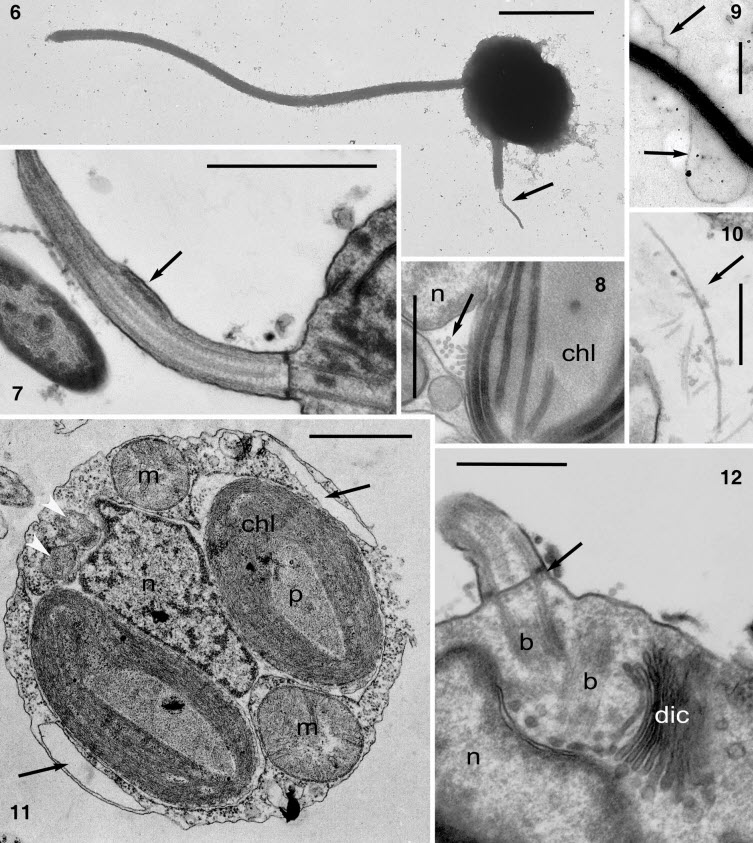
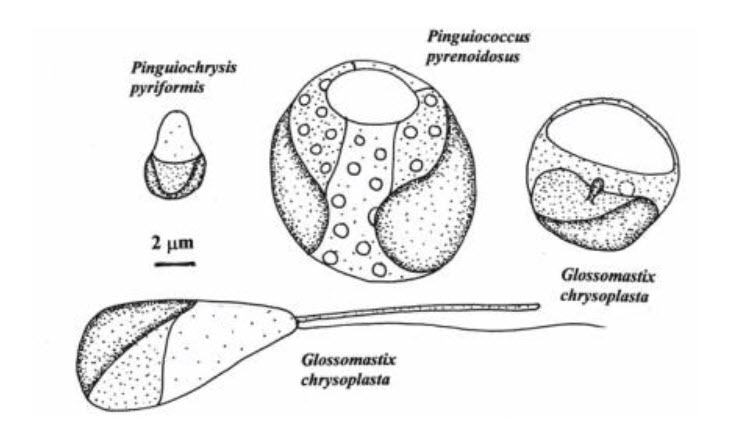
- Pinguiophyceae
Final presentation
Taxonomic groups
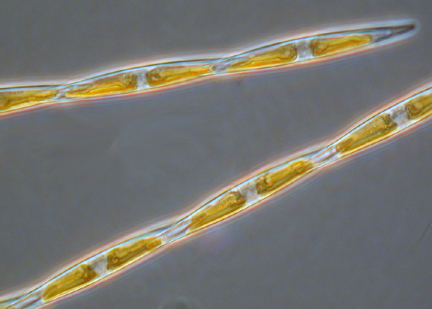
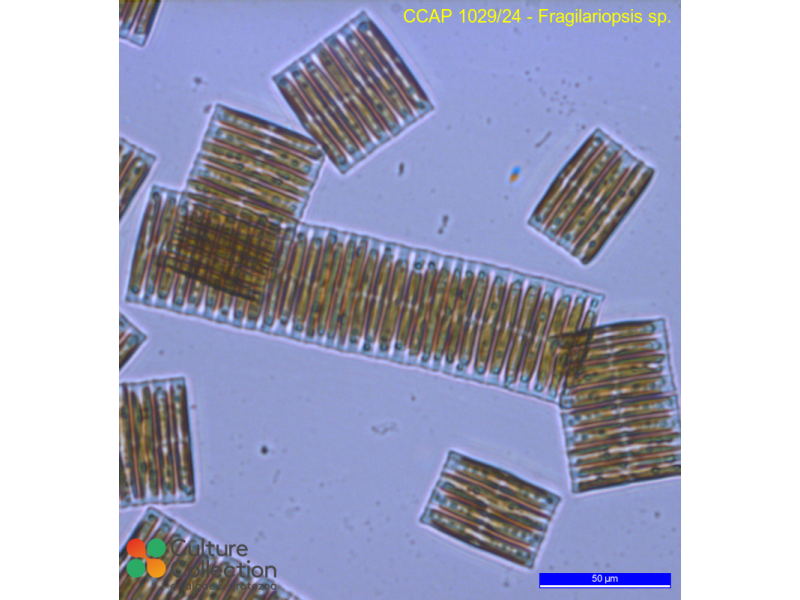
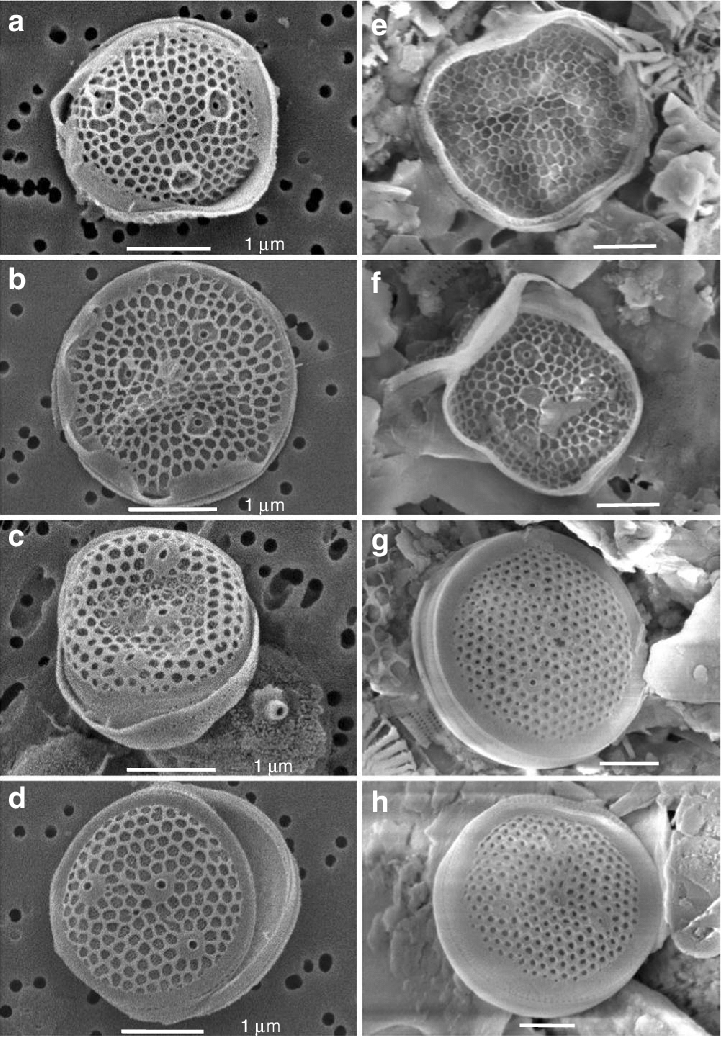
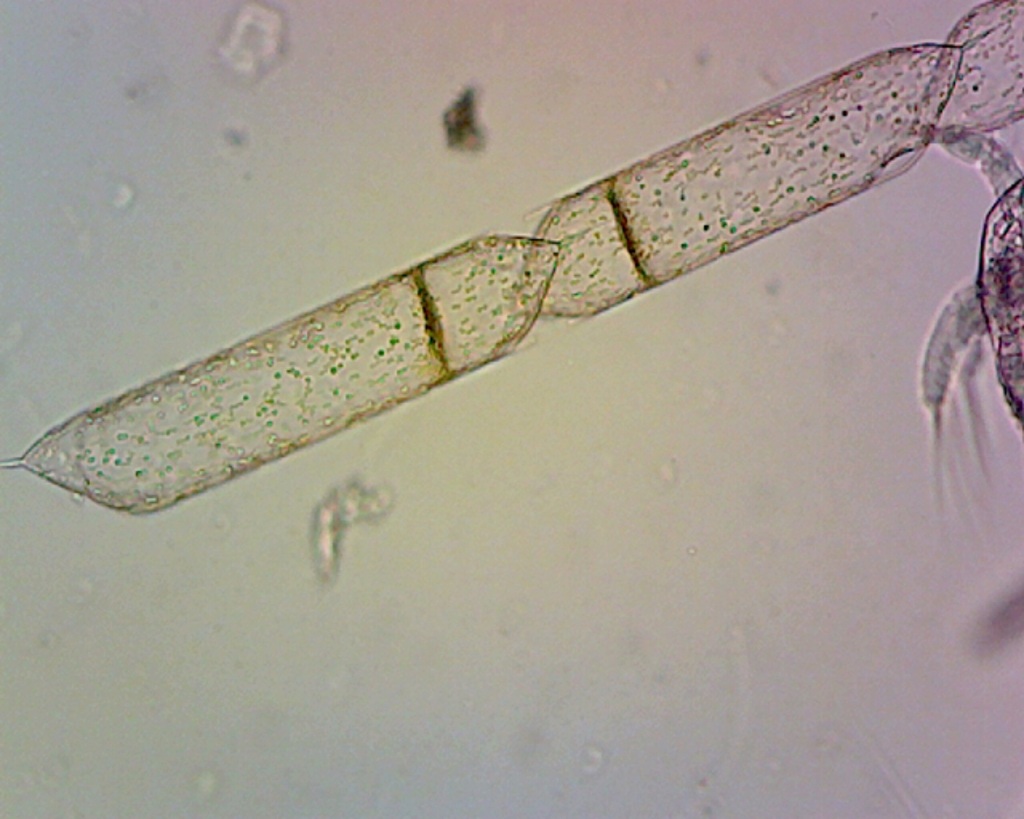
Diatoms
- Pseudo-nitzschia
- Fragiliaropsis
- Minidiscus
- Rhizosolenia
Dinoflagellates
- Dinophysis
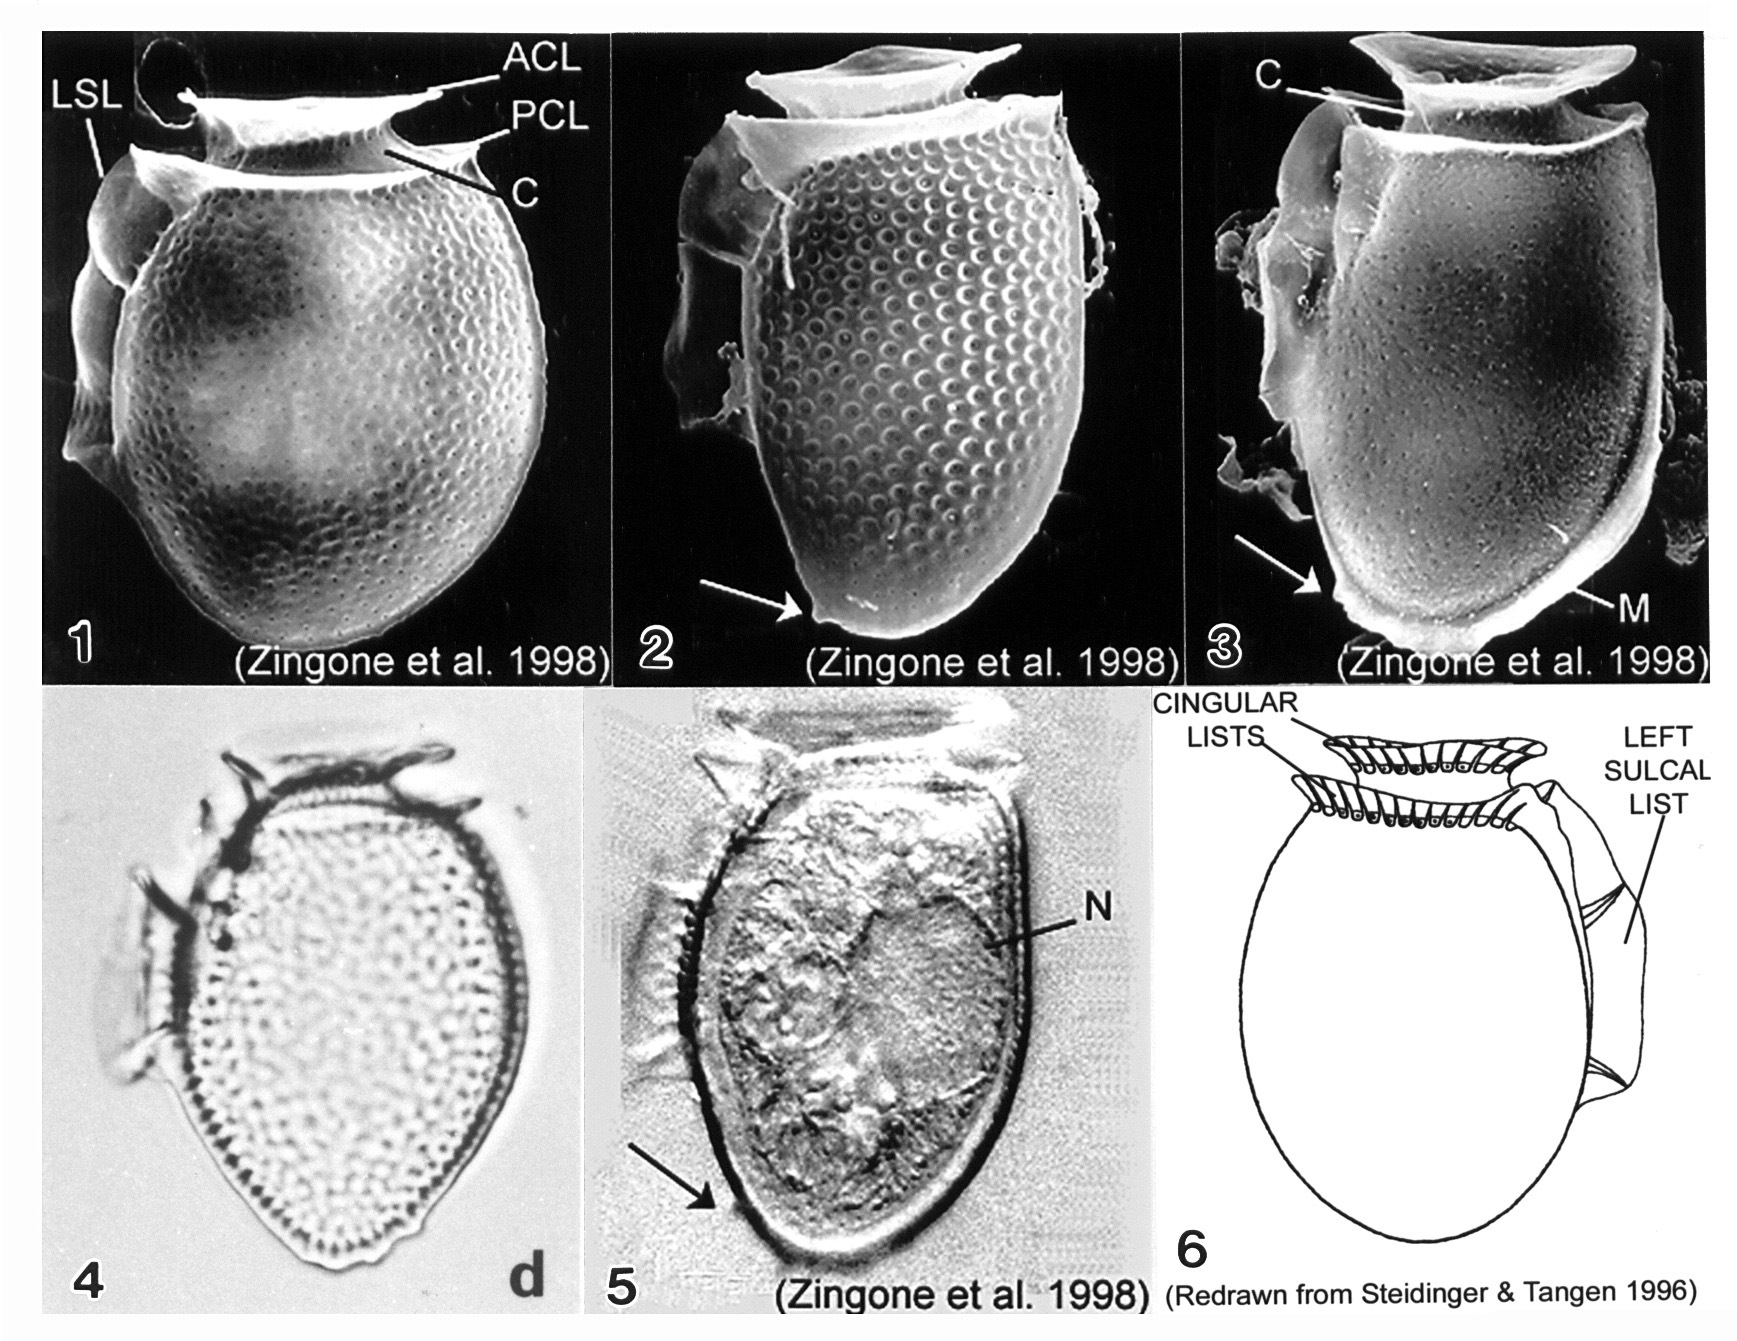
- Ceratium, Tripos