R course
Daniel Vaulot
2023-01-26
![]()
![]()
![]()
![]()
Metabarcode analysis - metaPR2
Outline
Intro to metaPR2
Visualization/Analysis
MetaPR2 in practice
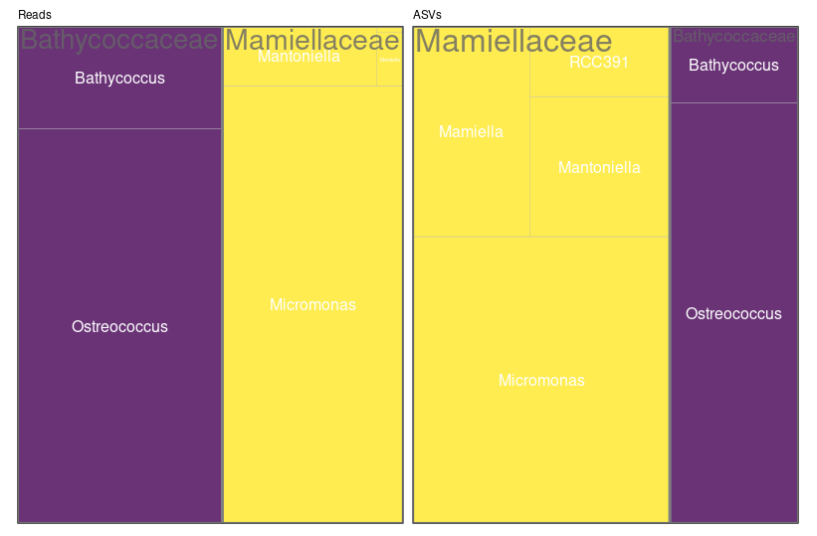
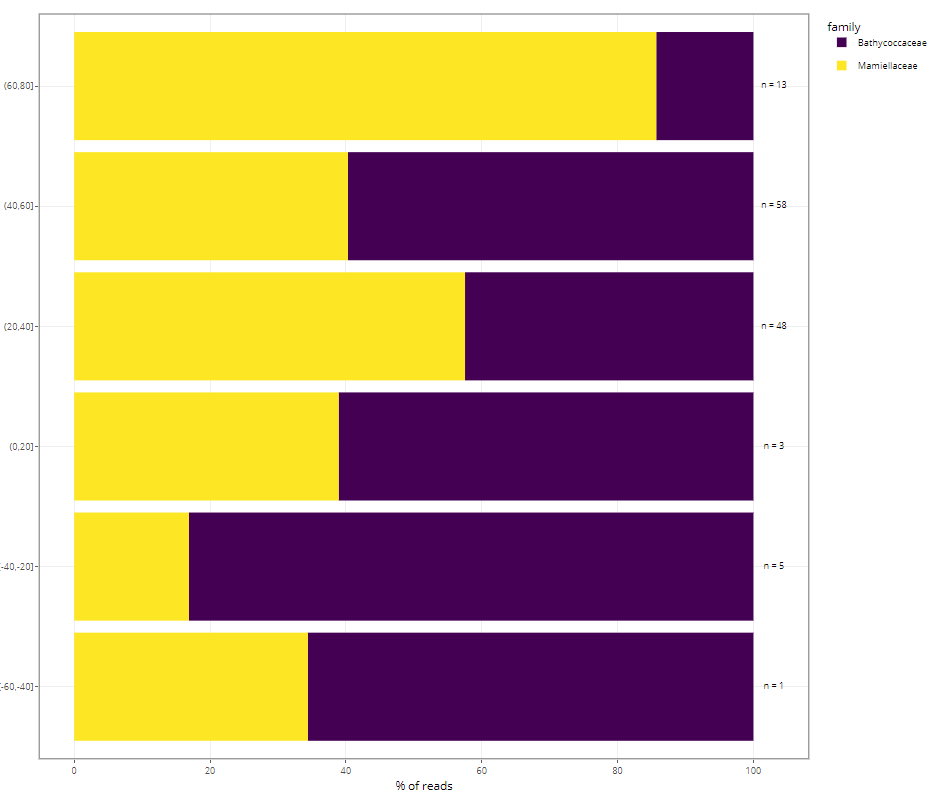
Barplots
![]()
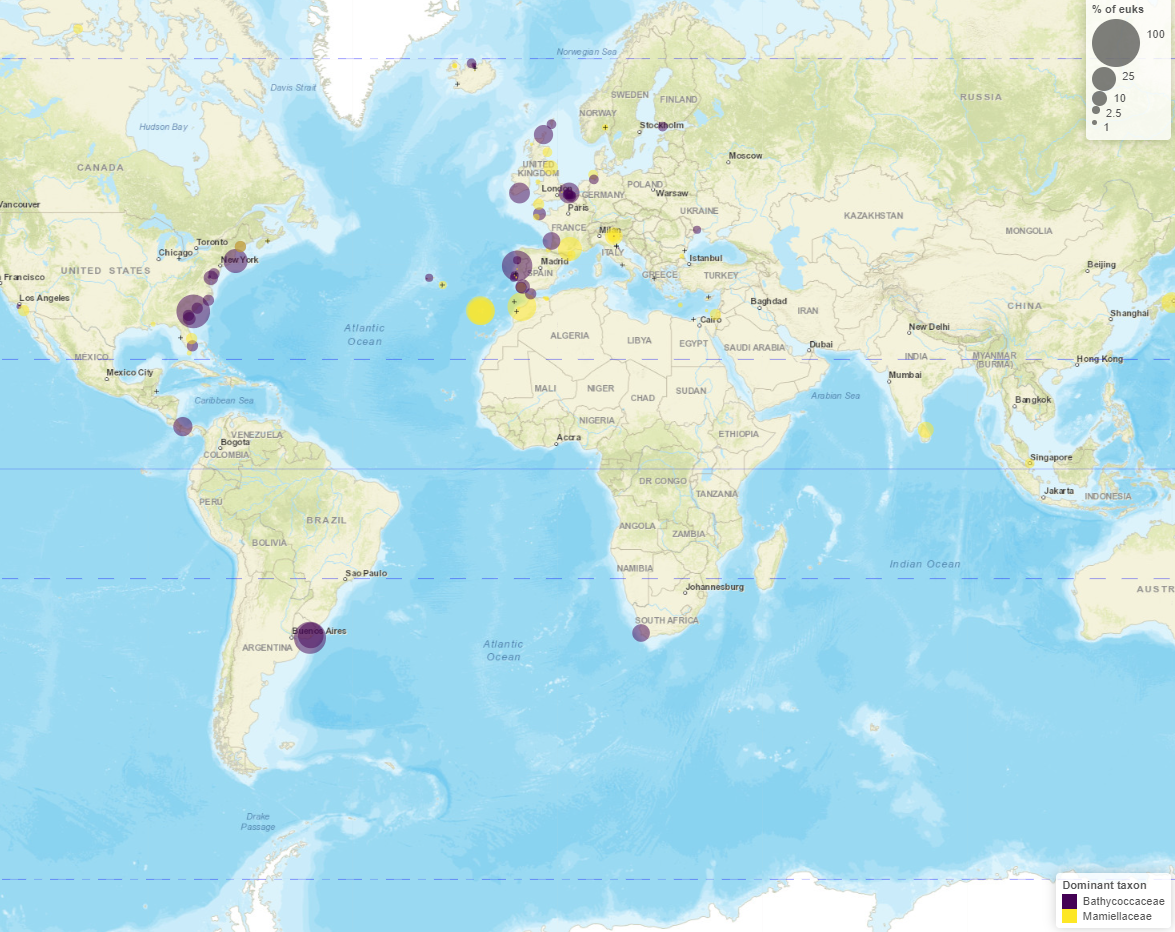
Maps - Dominant
![]()
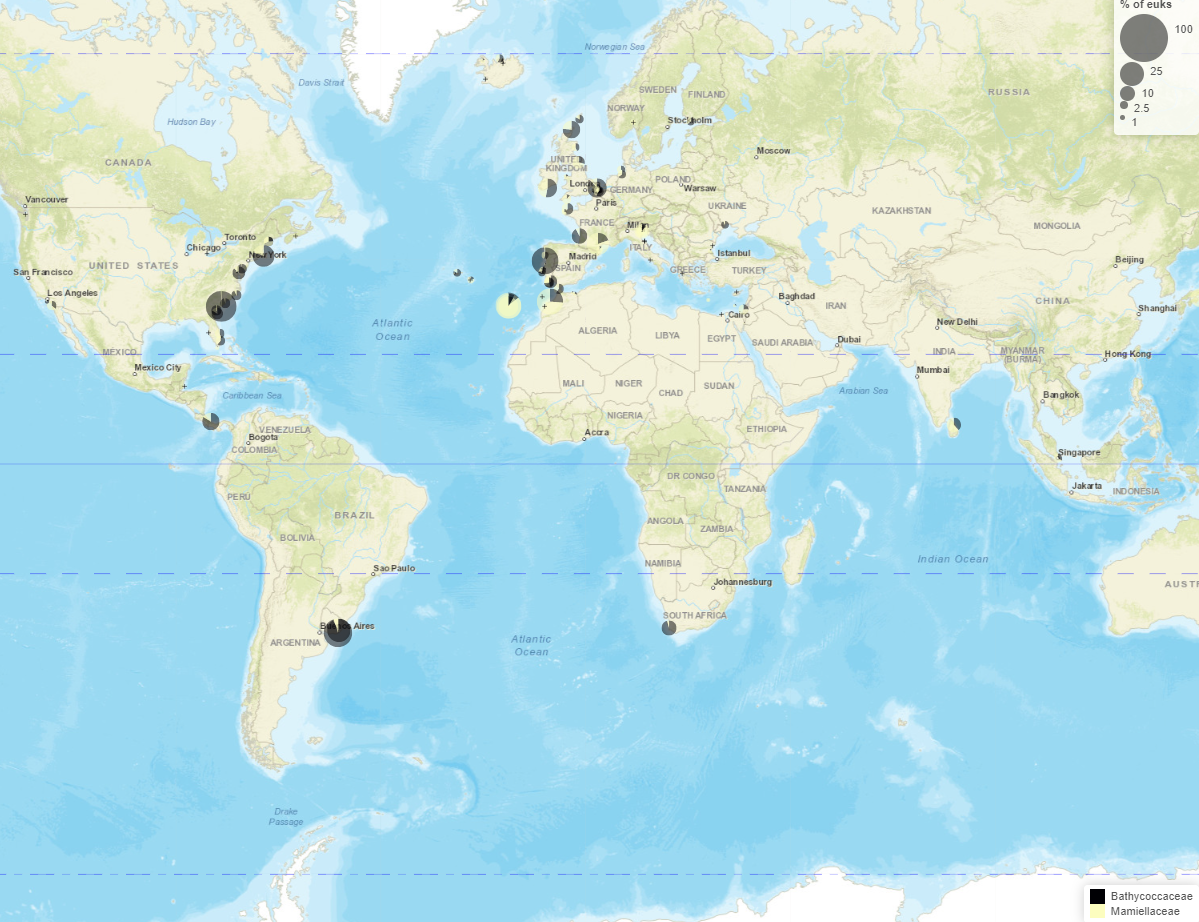
Maps - Pie charts
![]()
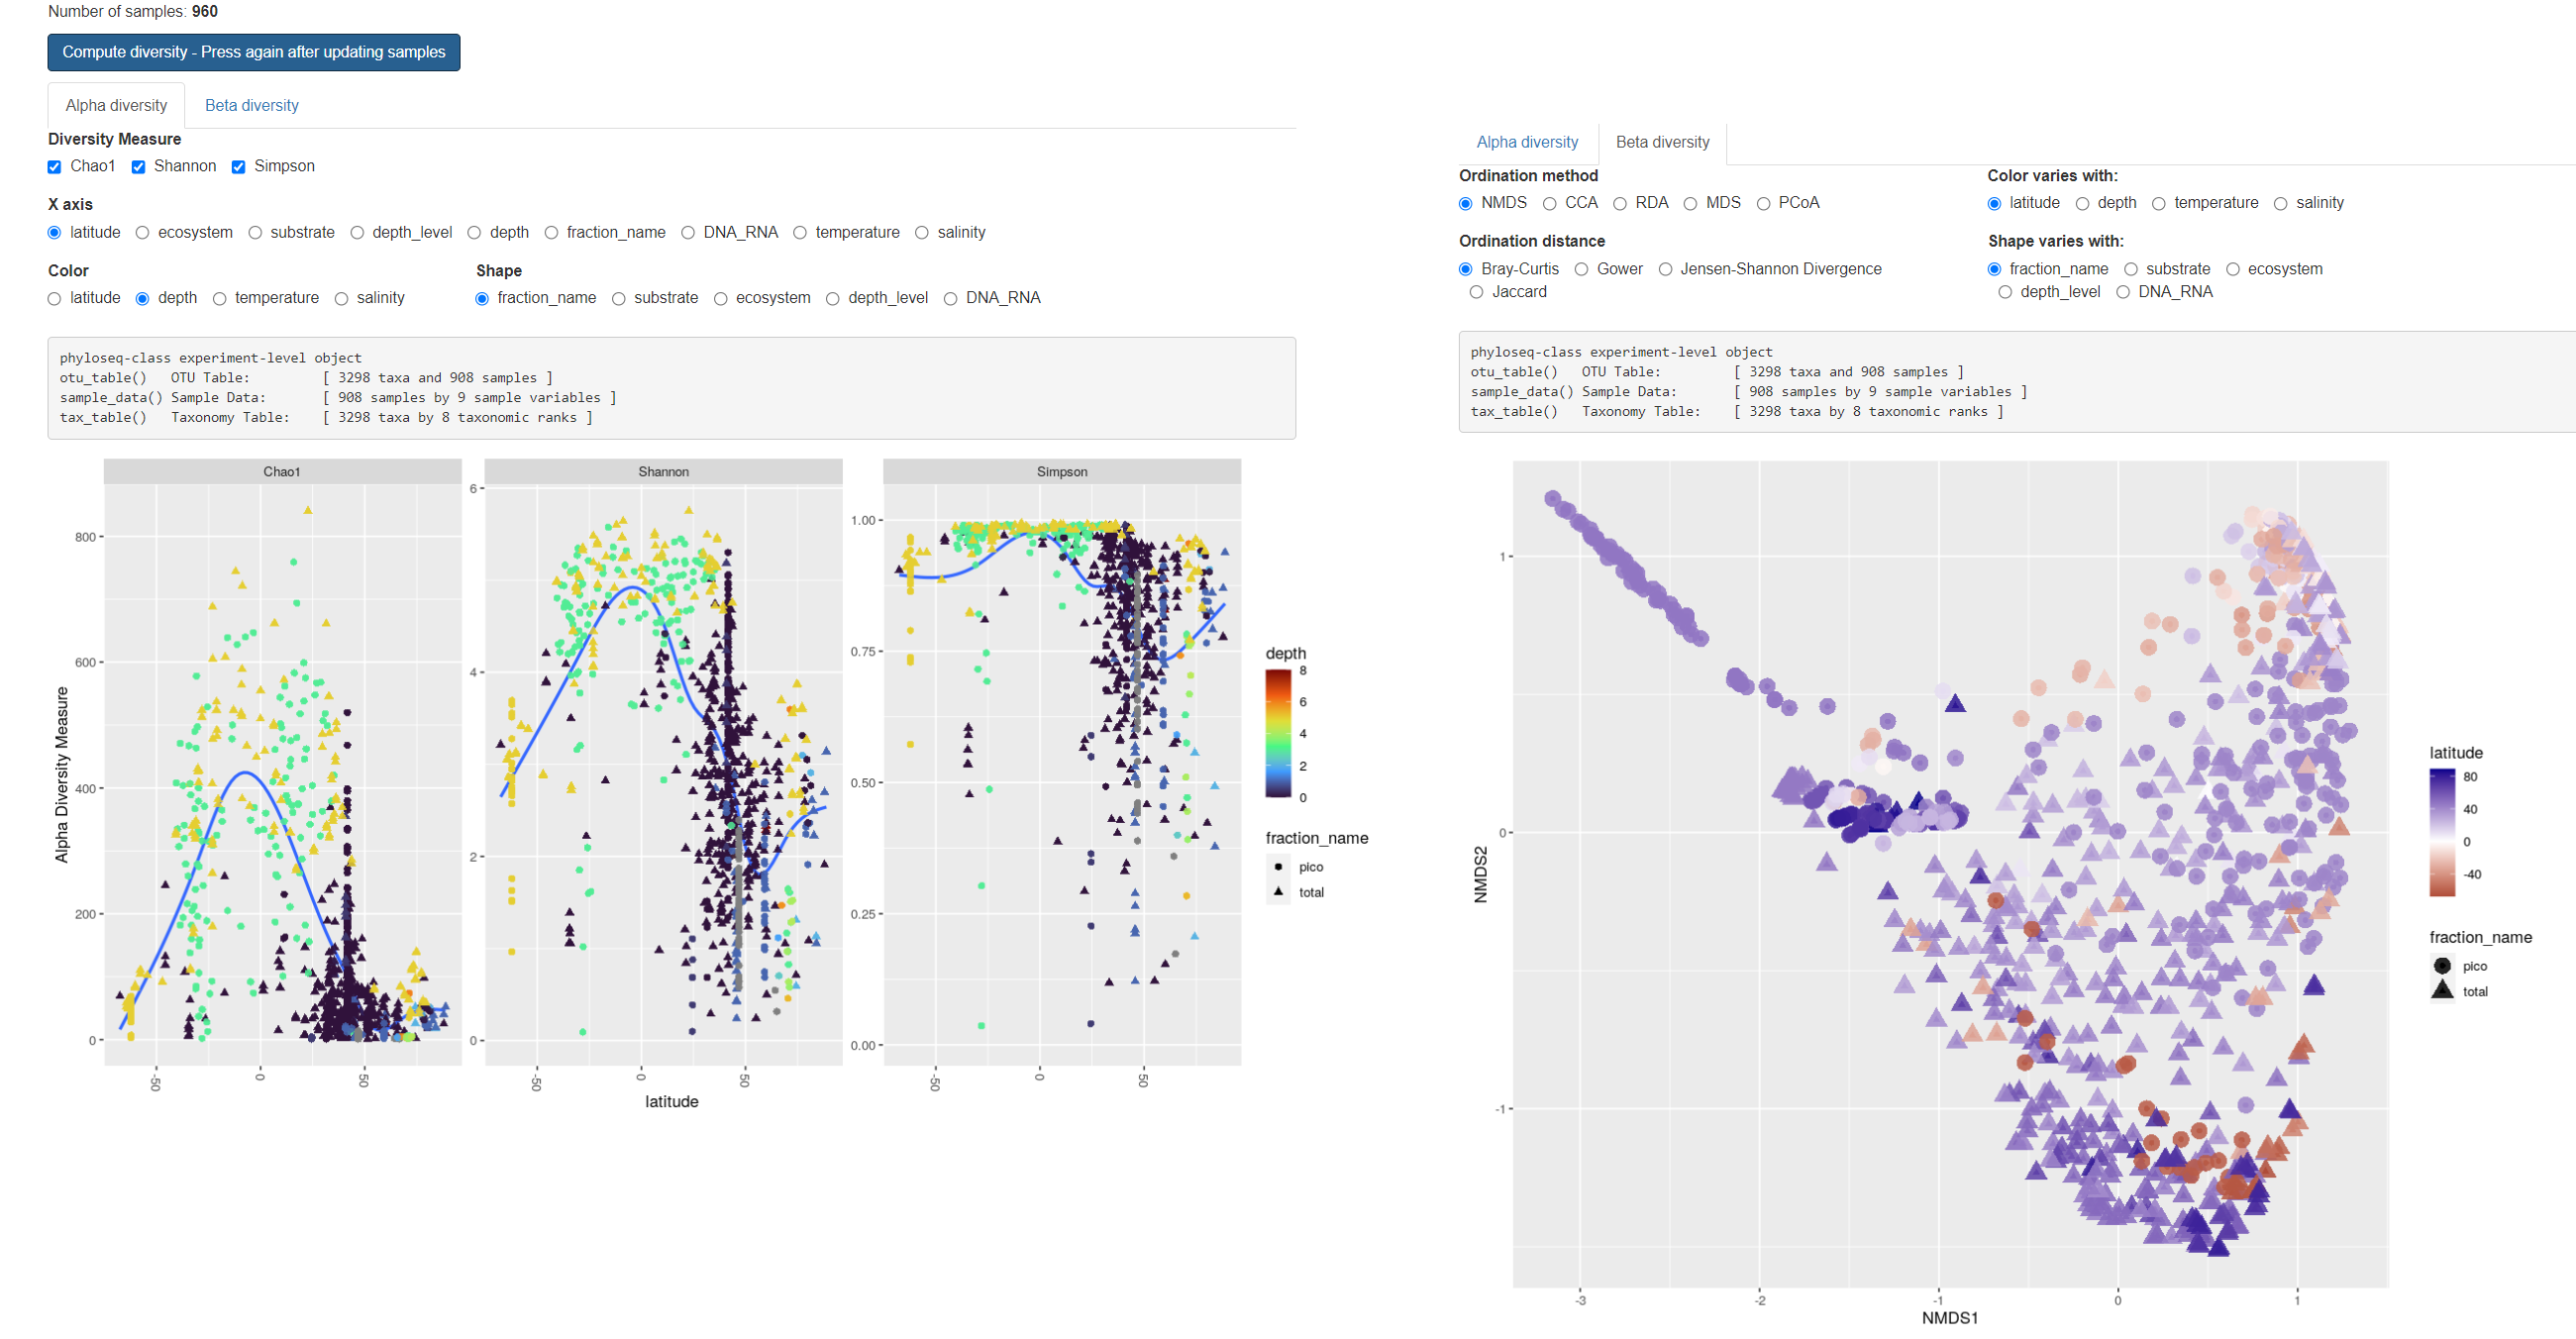
Diversity
![]()
Help and Samples
Help
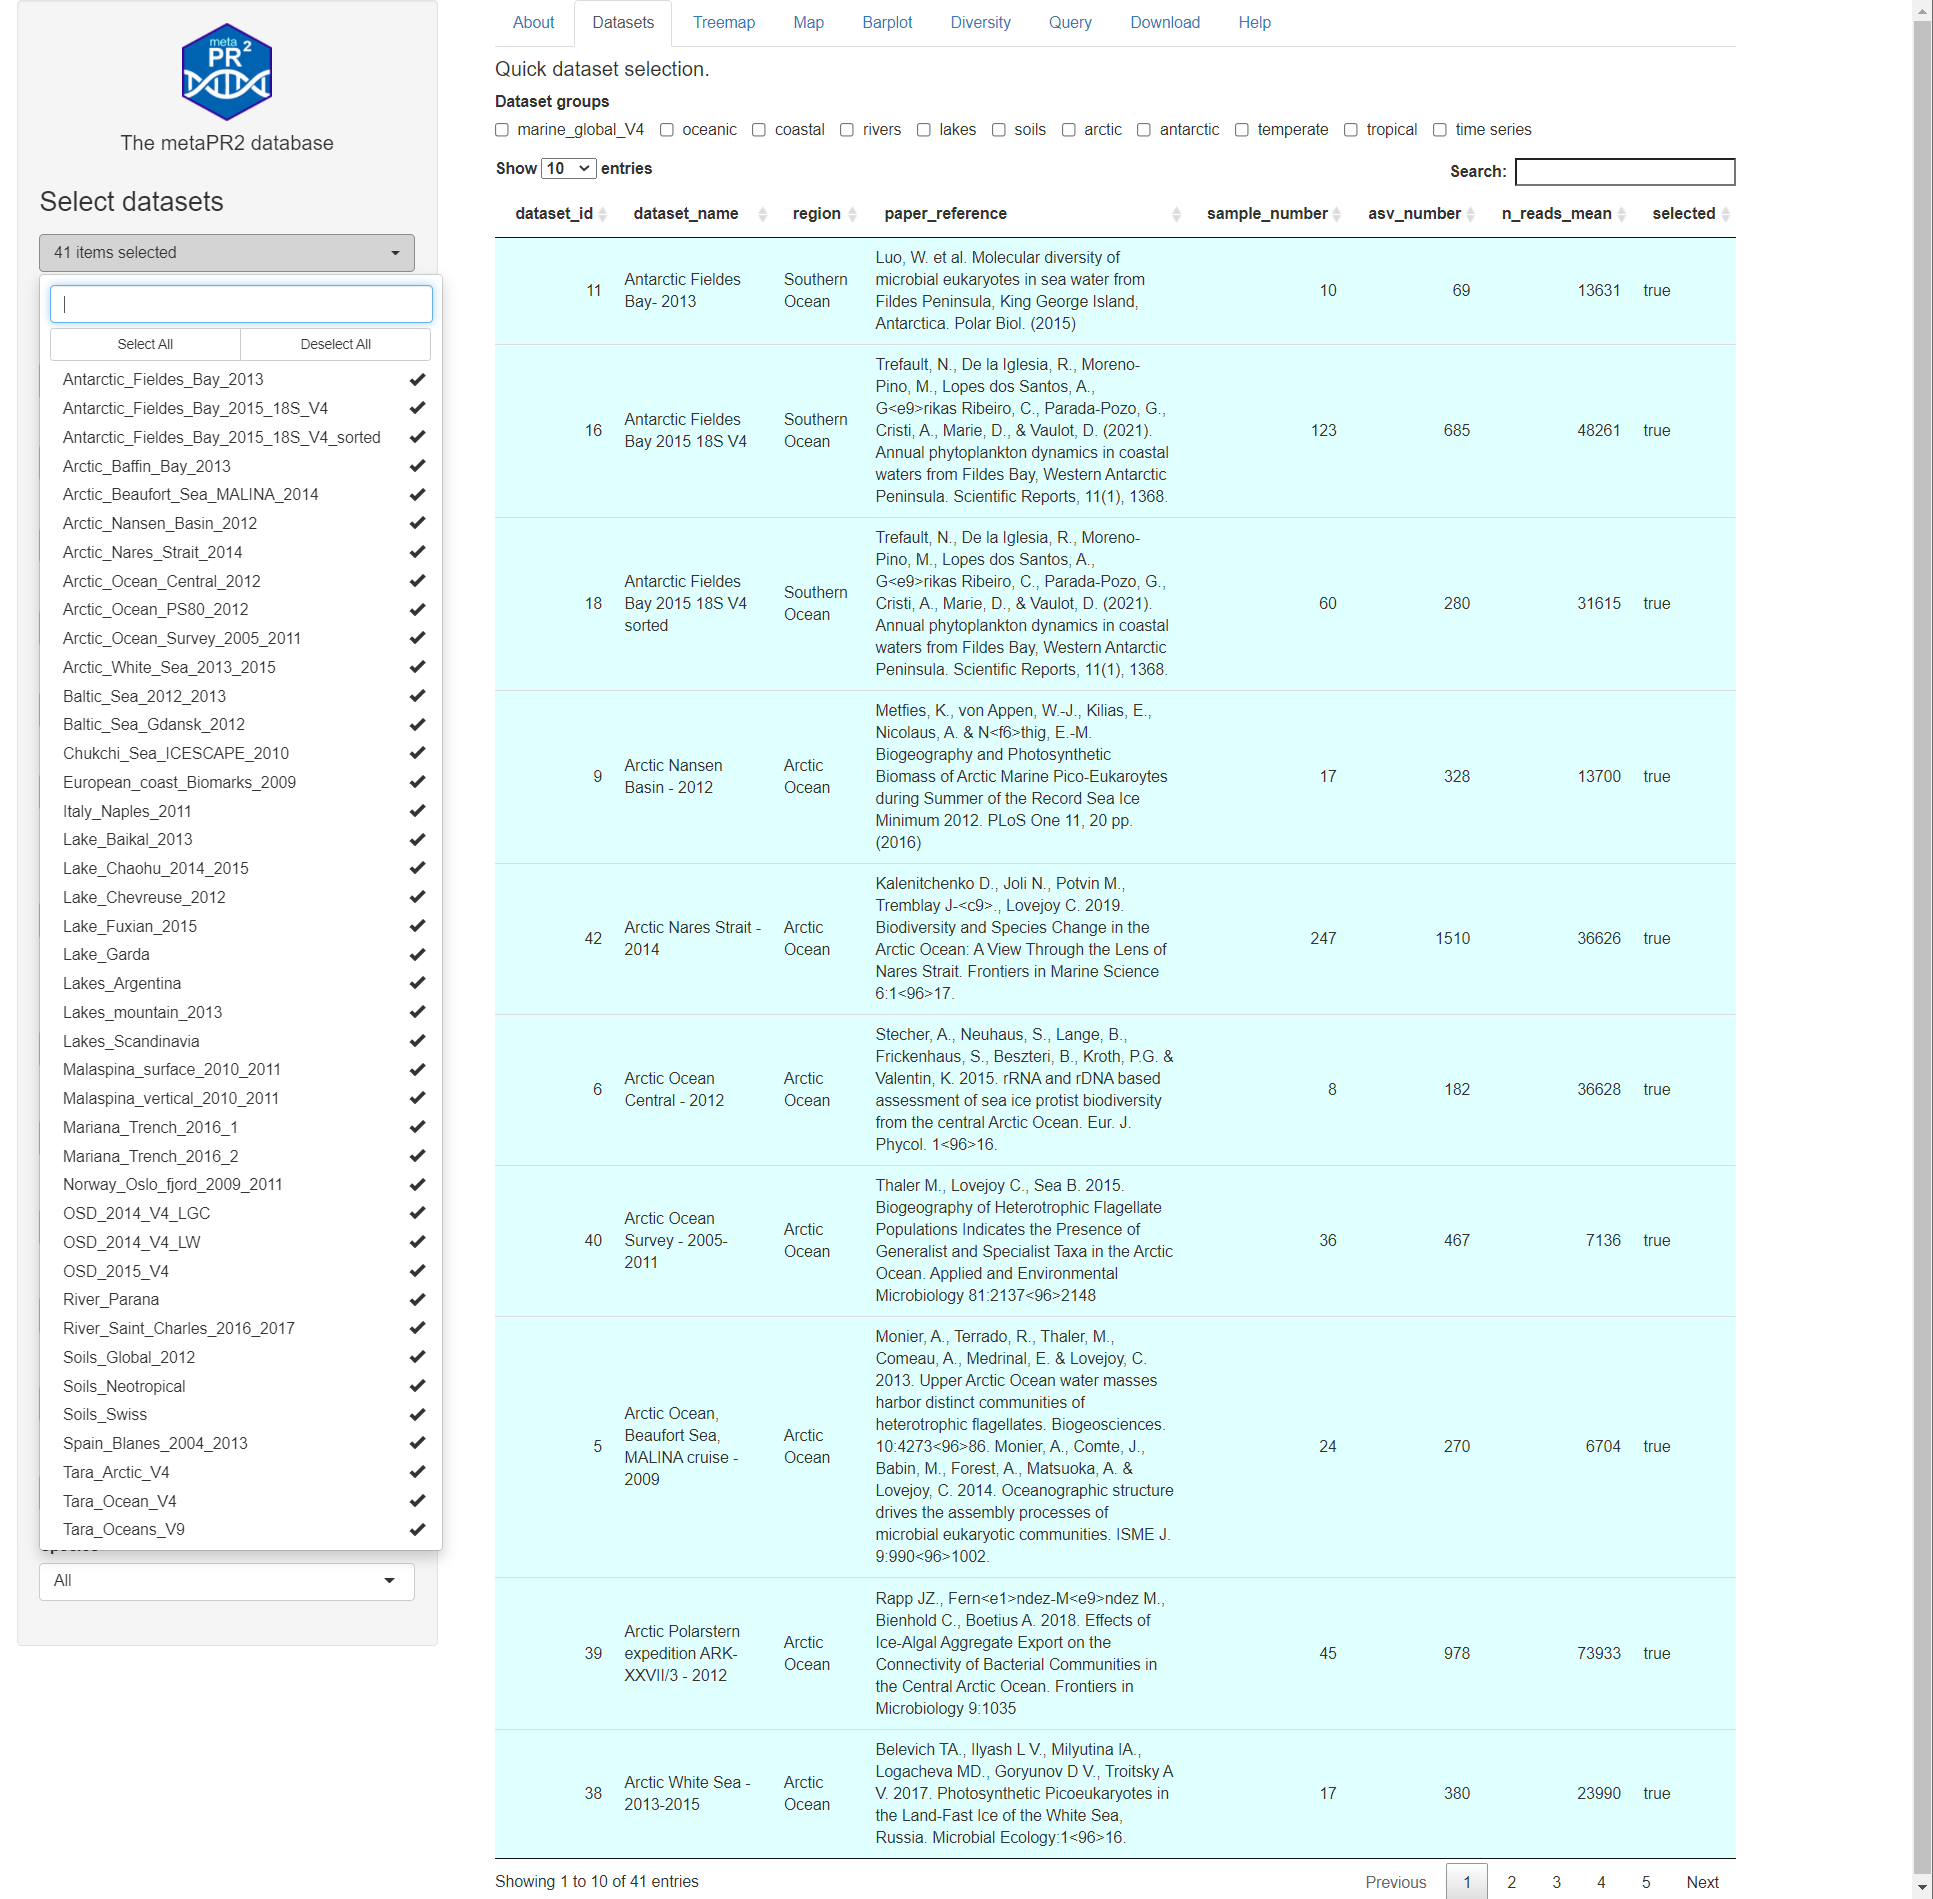
Sample table
- dataset_name
- paper (can be useful to read)
- number of samples
- number of ASVs
- number of reads per sample (coverage)
Sample selection
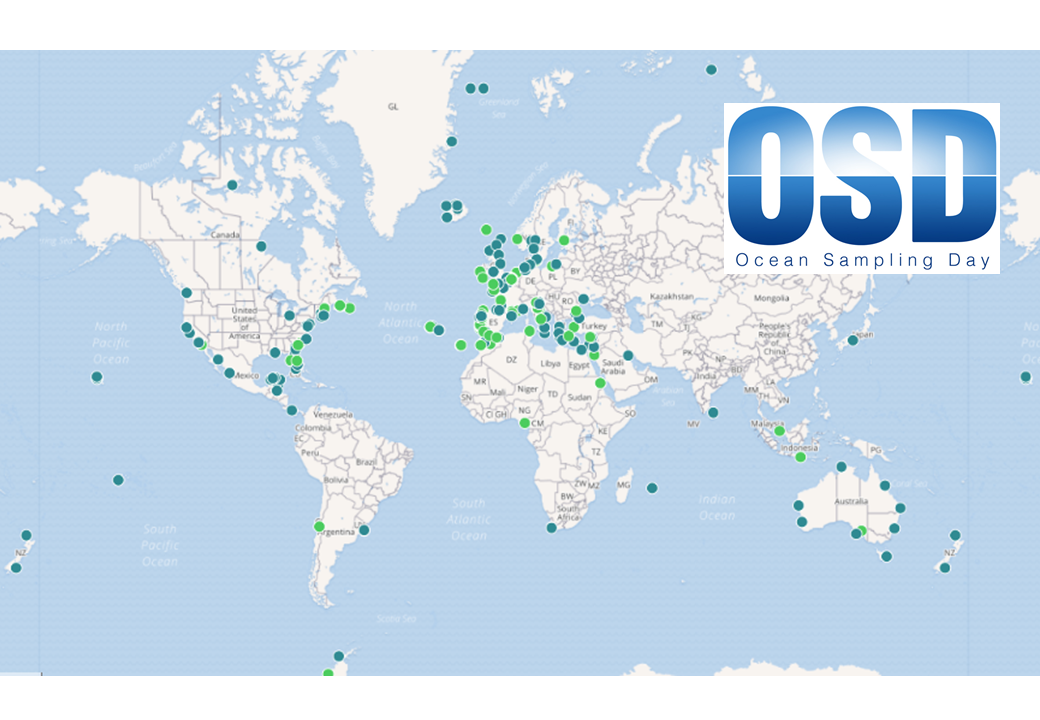
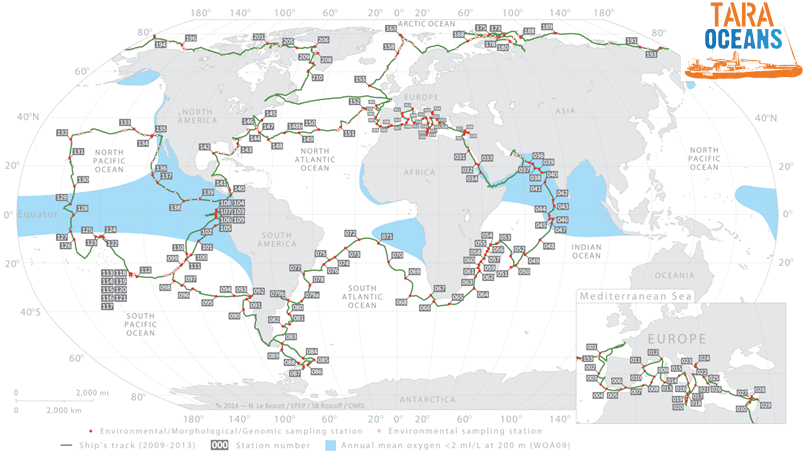
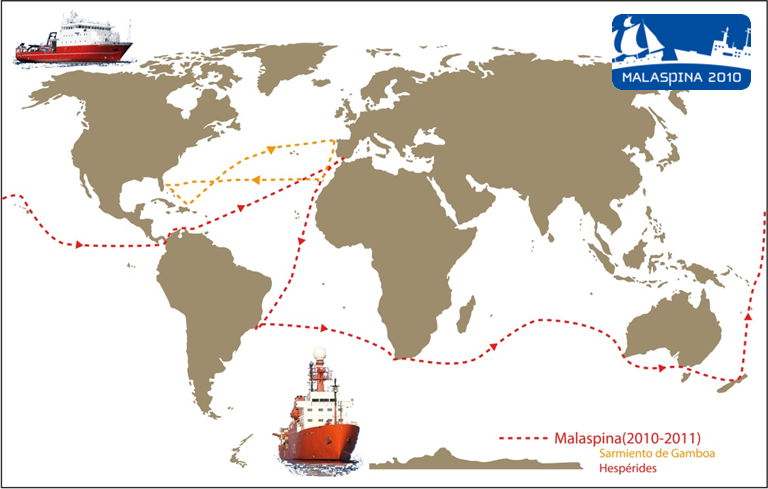
- Major datasets: OSD, Tara, Malaspina
- By habitat: oceanic, coastal etc…
- Start by “marine global V4”
- Extend to other habitats/datasets
- V4 vs V9
- DNA vs. RNA
- Ecosystems
- Sustrate: water, ice, soil…
- Size fractions: total, pico…
- Depth level: surface, euphotic…
- Minimum ASV: will filter out rare ASVs (e.g. 1000)
- Selection can be saved (yaml file)
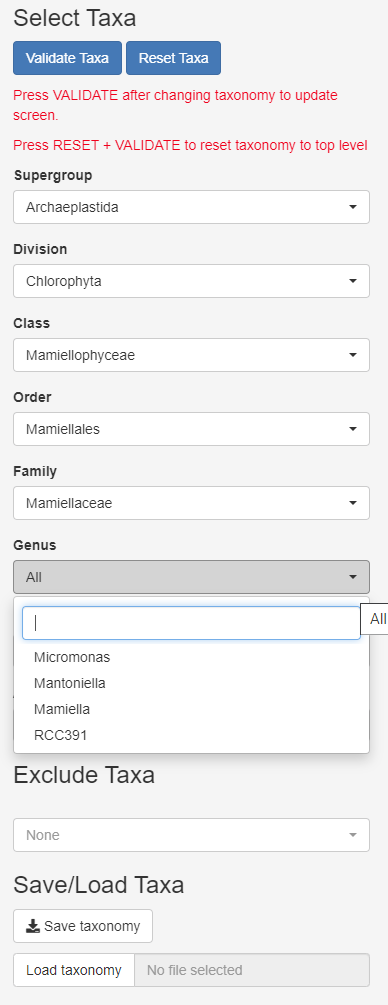
Taxonomy
- Can select several taxa within one level
- Press validate every time you need to refresh
- Can exclude taxa to remove fungi, metazoa…
- Can save taxonomy and reload taxonomy (yaml file)
Treemaps, Maps and Barplots
Treemaps
- Left panel: abundance (number of reads)
- Reads are “normalized” to 100
- Right panel: diversity (number of ASVs)
Maps
- Read information at top
- Taxo level
- Number of samples with/without taxa
- Crosses where taxa absent
- Map types
- Circle scale
- Moving right increases size
Barplots
- taxonomy vs. function
- variables to use (but this depends on samples selected !)
- fraction name
- ecosystem
- substrate
- depth level
- DNA_RNA
- latitude
- temperature
- salinity
- year, month, day for time series
Diversity
- Hit “Compute…” after refreshing taxonomy
- Time proportional to N samples and taxa
- Information about
- Number of samples
- Number of taxa (ASVs)
Alpha diversity
- X: Chao1, Shannon, Simpson (compare)
- Discretize continuous Y
- Change Y (see barplots)
- Change shape
- Change color
Beta diversity
- Ordination method (difference ?)
- Ordination distance (Bray, Jaccard…)
- Change color and shape
Download
- Download
- datasets
- samples
- asv list with taxonomy
- asv sequences
Only for those with extensive experience with data processing.