R course
Daniel Vaulot
2023-01-26
![]()
![]()
![]()
![]()
Metabarcode analysis - Introduction
Metabarcoding
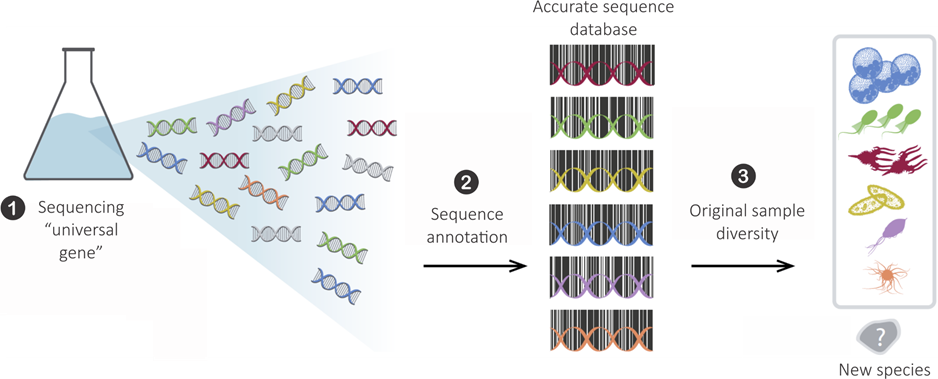
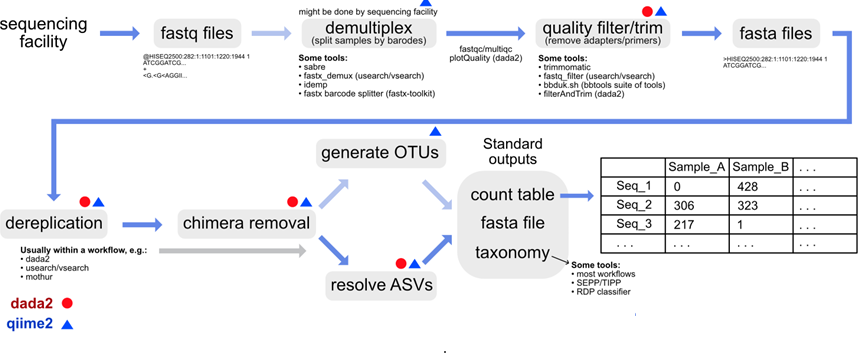
Sequences
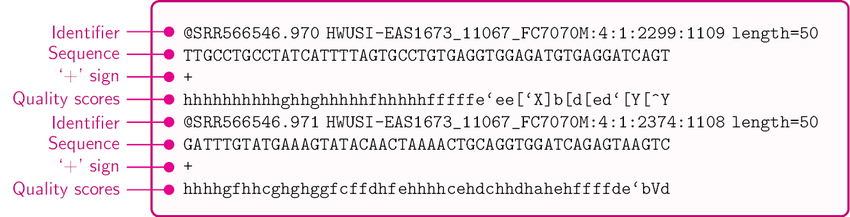
Fastq files
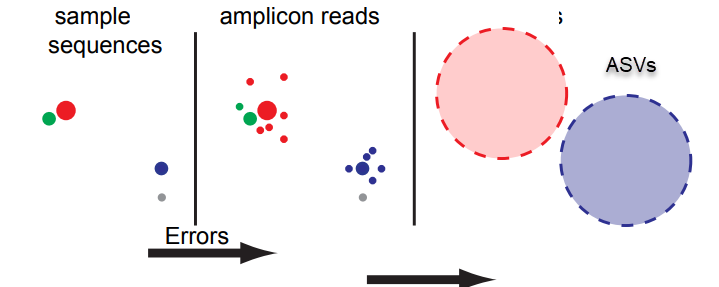
Cluster
Assign
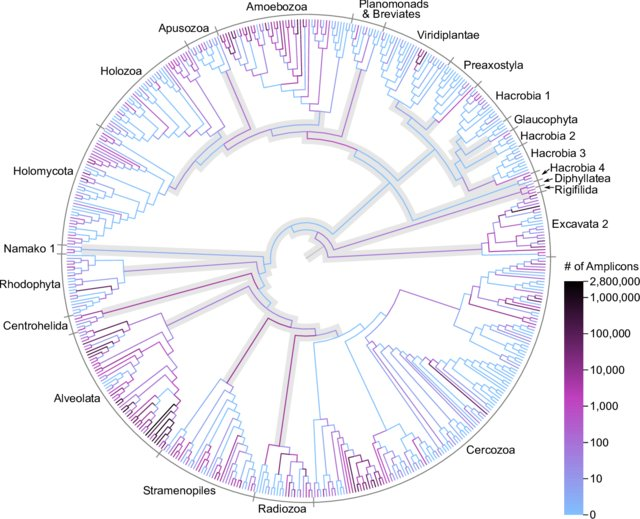
Metabarcoding pipeline
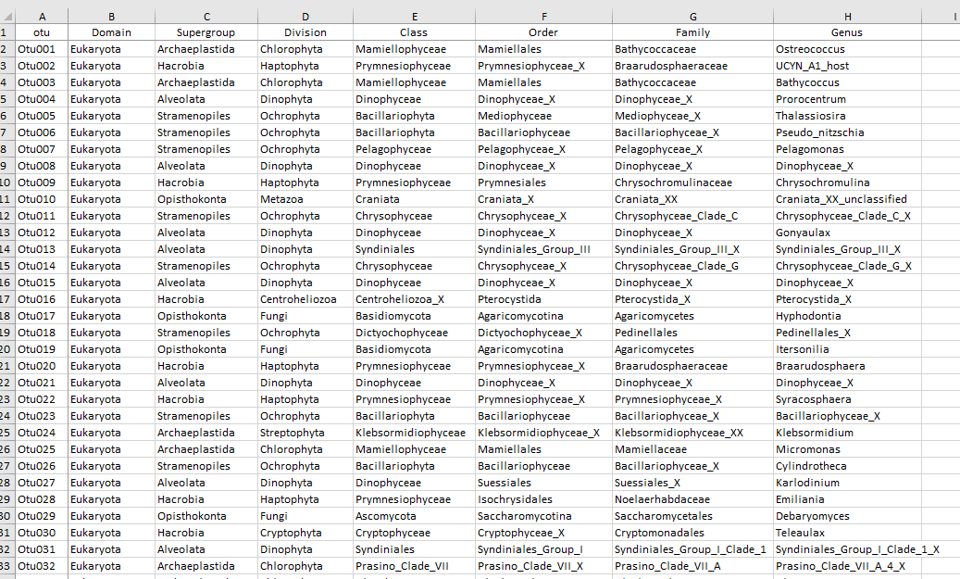
Data tables - ASVs
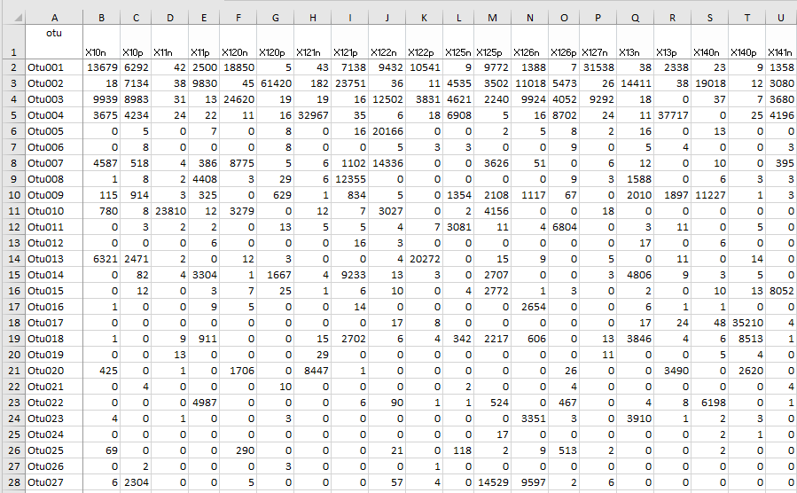
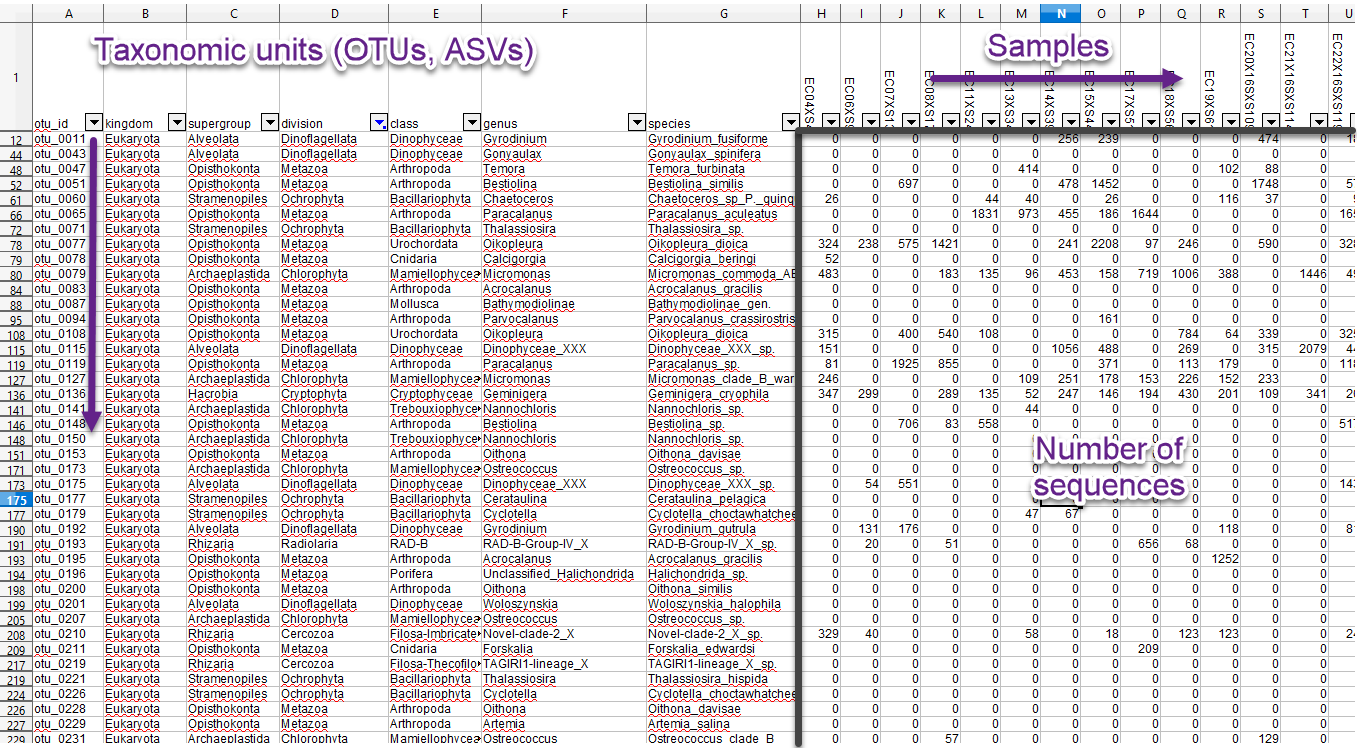
Data tables - Abundance
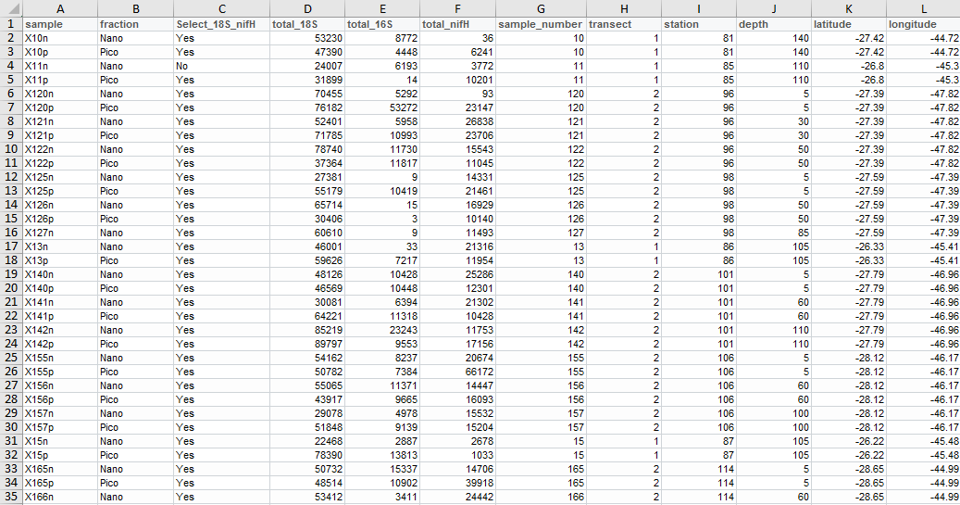
Data tables - Metadata
Data tables - Merged
Factors affecting protist communities
Environmental conditions
In oceanic waters:
- temperature
- salinity
- light
- nutrients
… which depend on:
- substrate (water vs.ice)
- latitude
- time of the year
- depth
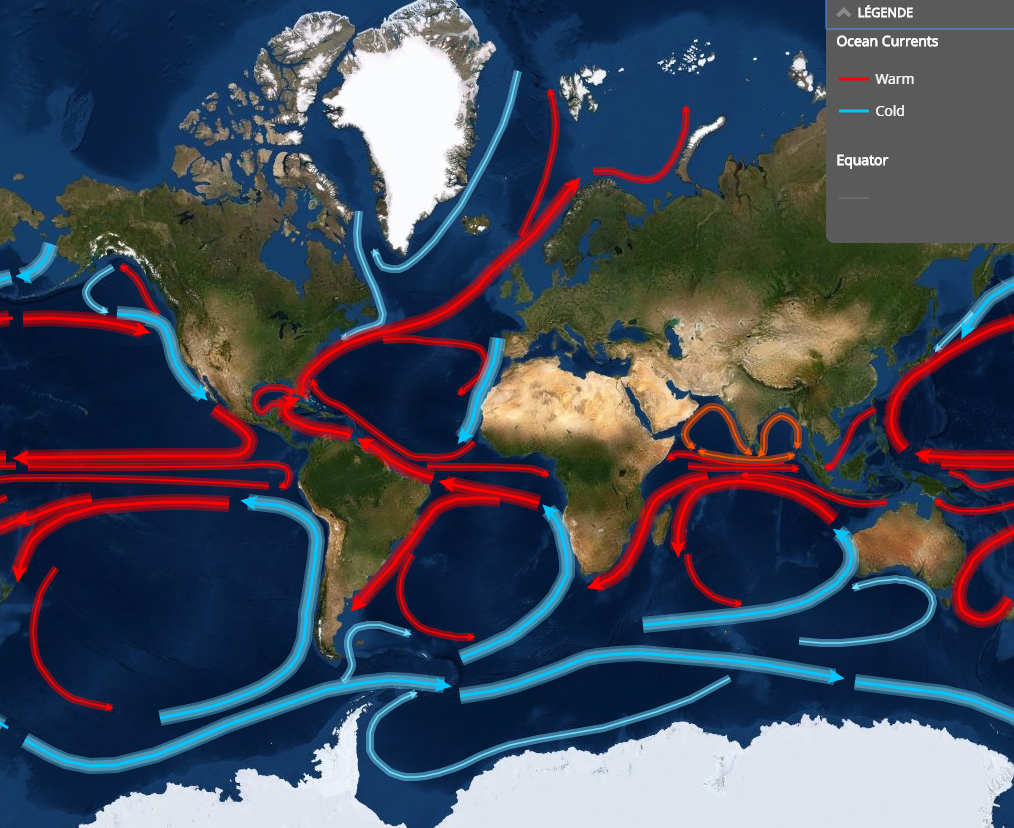
- oceanic currents
- proximity of coast
Diversity
Microbial species in a sample
- species richness: total number of species
- species abundance: proportion of each species
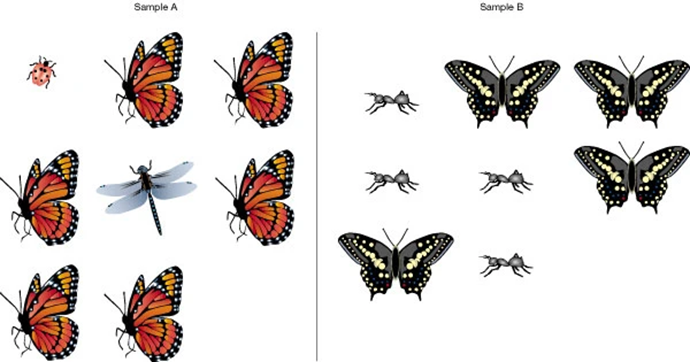
Richness vs. Evenness
Diversity
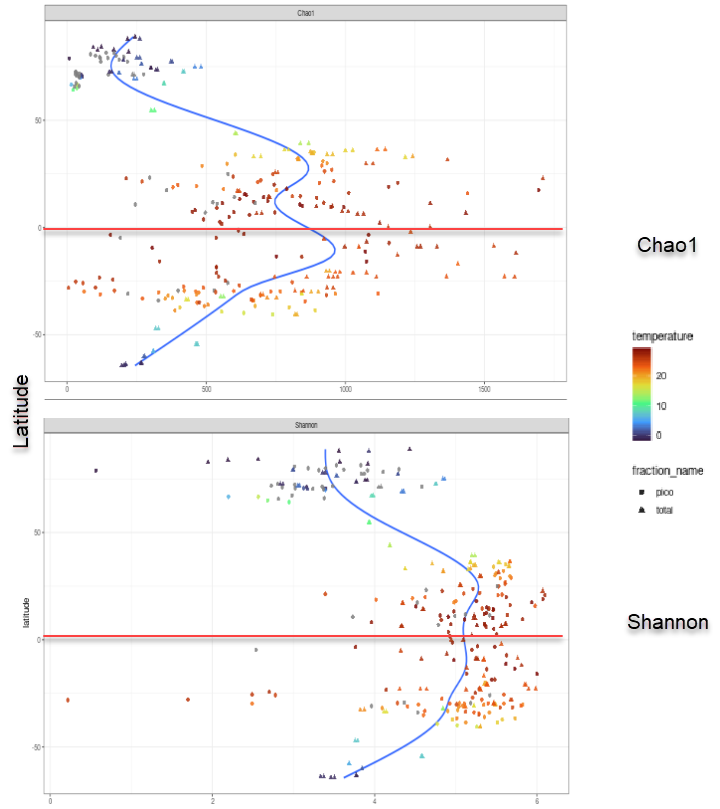
Alpha diversity - Effect of latitude
Diversity
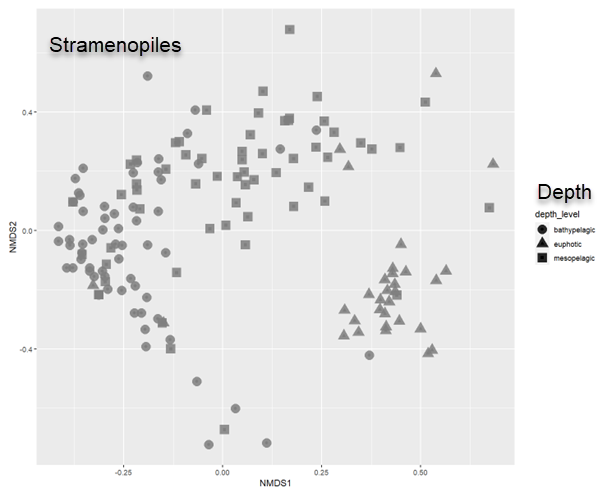
Beta diversity - Effect of depth on Stramenopiles communities