R course
Daniel Vaulot
2023-06-21


Introduction to R
R sessions
- 01 - Introduction to R
- 02 - Data wrangling
- 03 - Data visualisation
- 04 - Markdown
R - Session 01
- What is R and why use R ?
- Resources
- Get started
- Fundamentals of R
- Data objects
- Vectors
- Operators
- Functions
- Packages
Introduction

- If you are an R guru:
- Please refrain to answer during this session…
- Help your neighbor
- Two special slide formatting
- Your turn…
- Warning
R
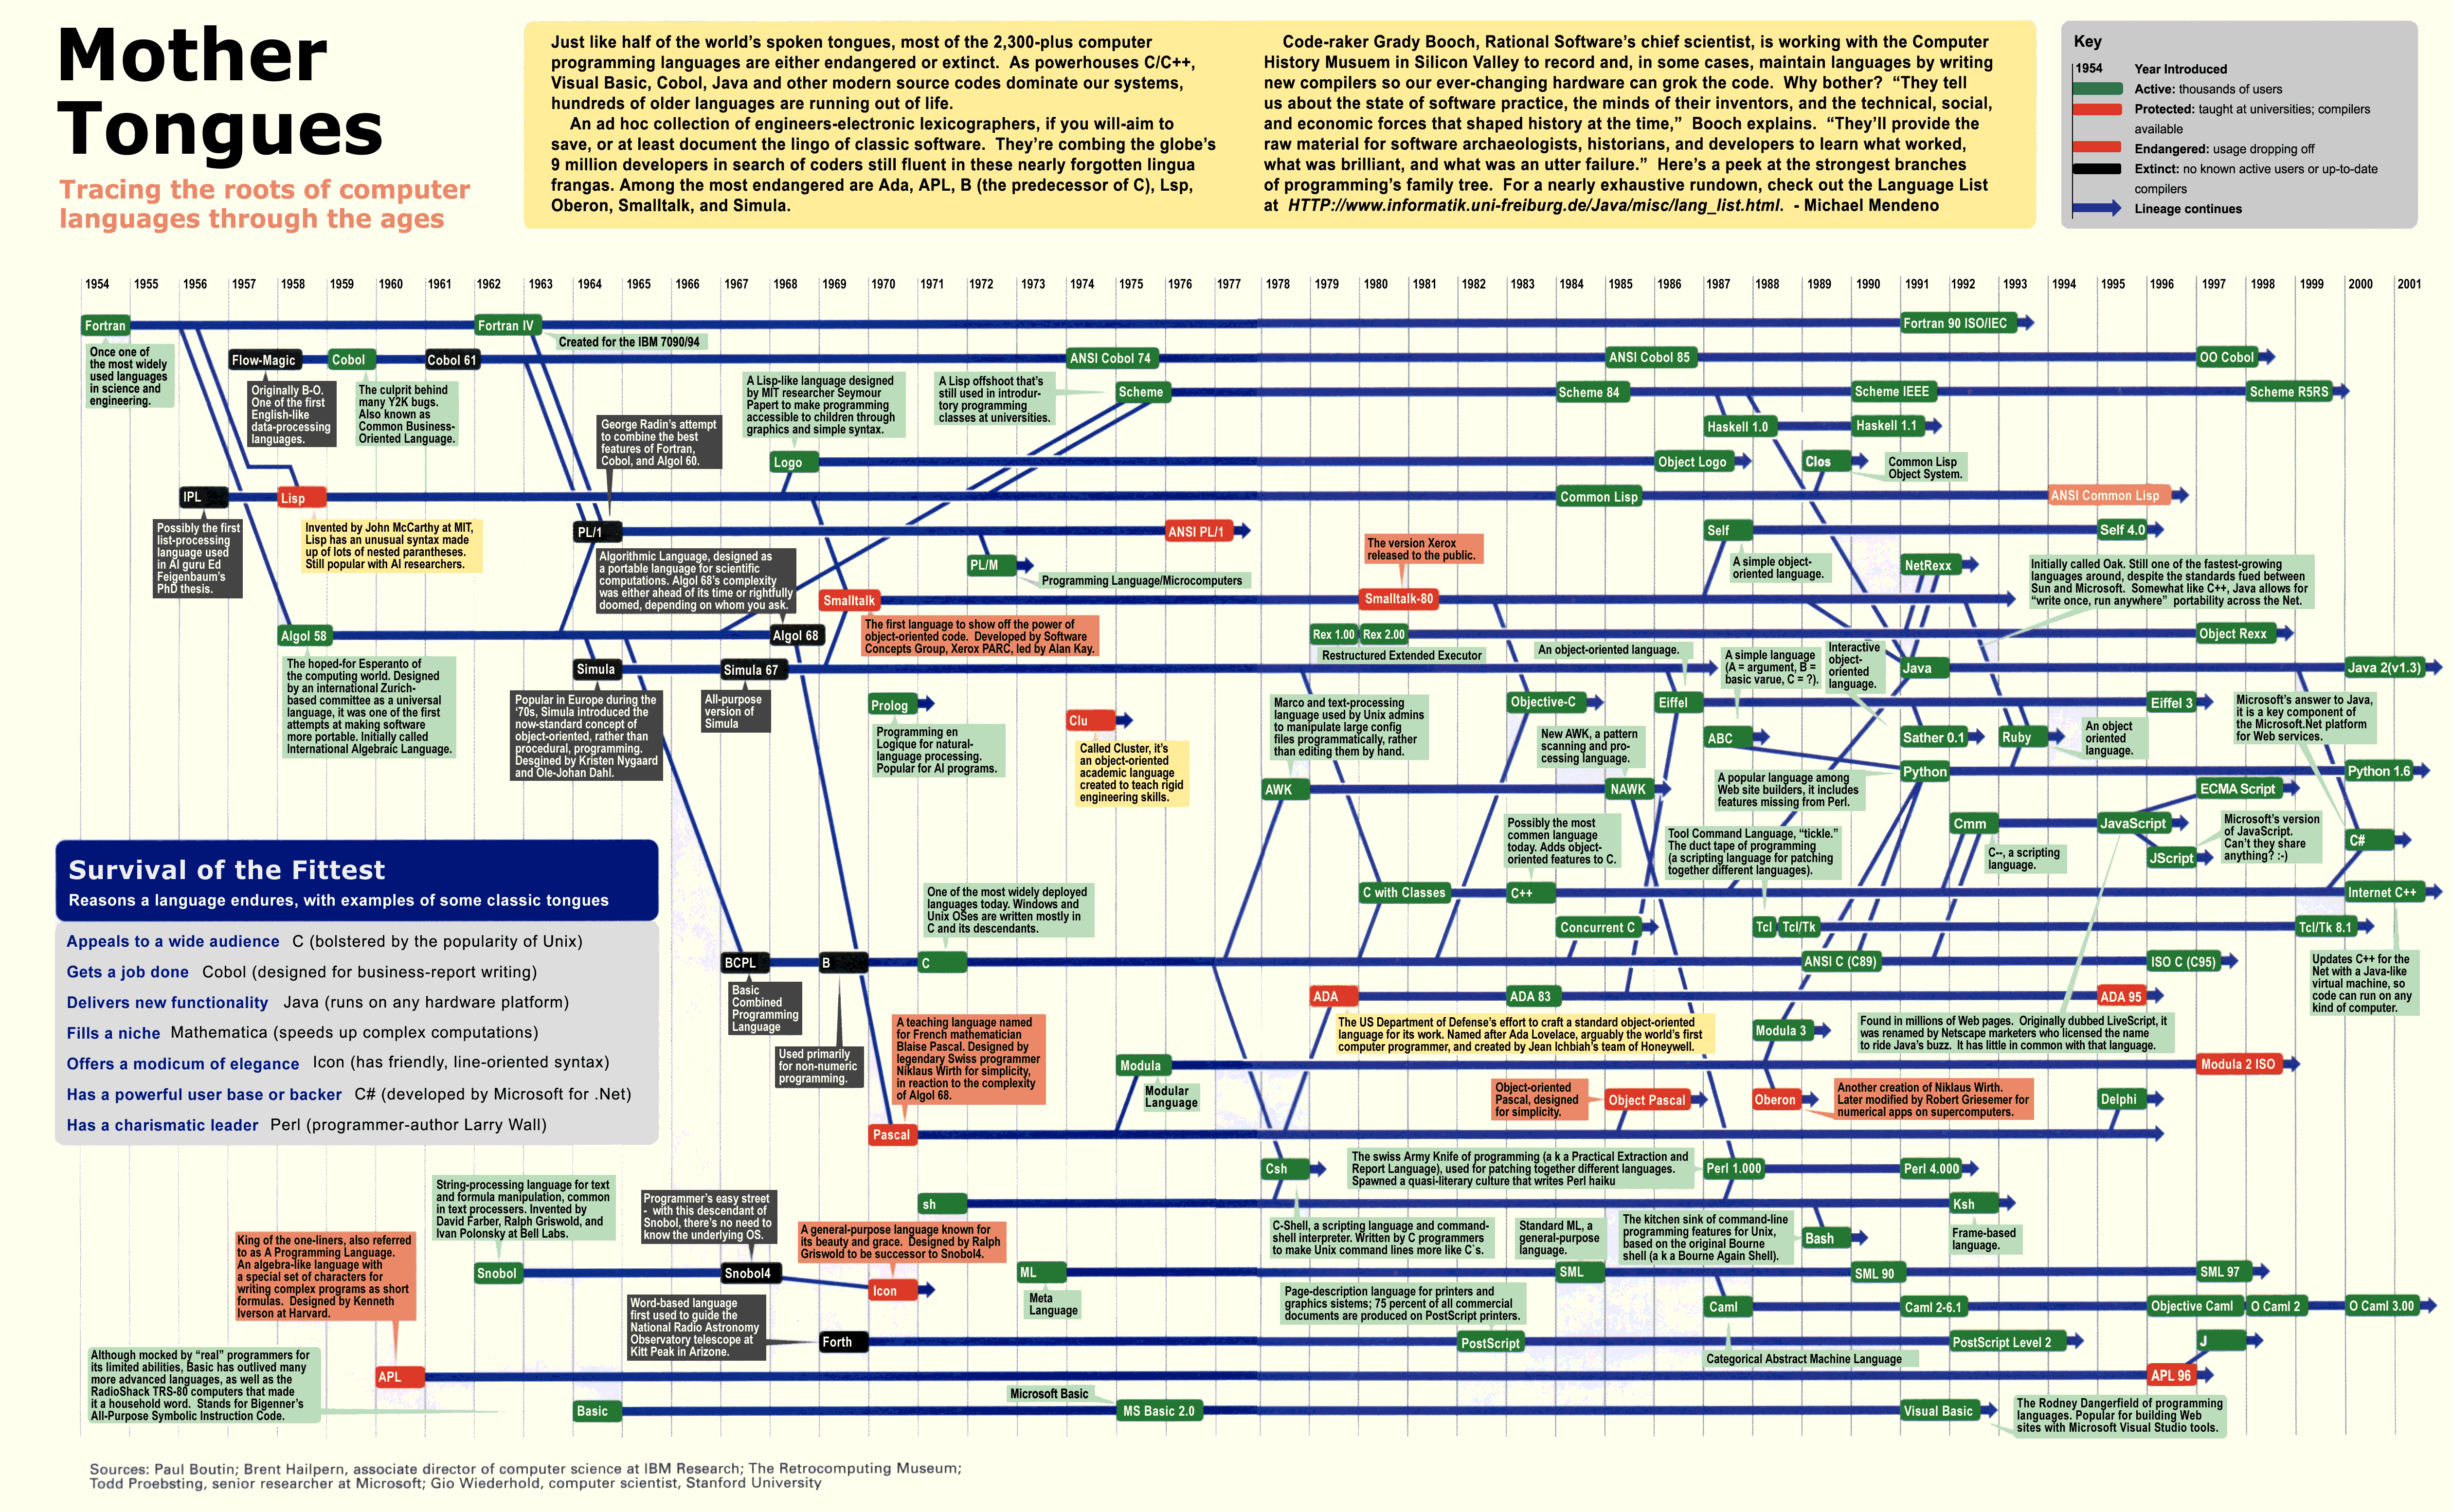
History of computer languages
History of R

Mid 1970s - S Language for Statistical Computing conceived by John Chambers, Rick Becker, Trevor Hastie, Allan Wilks and others at Bell Labs
Early 1990’s - R was first implemented in the early 1990’s by Robert Gentleman and Ross Ihaka, both faculty members at the University of Auckland.
1995 - Open Source Project
1997 - Managed by the R Core Group
2000 - First release of R
2011 - First release of R studio
Why use R ?
- Script vs. Menu driven software (e.g. Excel)
- Can be re-rerun with new data
- Reproducible workflow
- Open source
- Huge number of libraries
- Tidy “universe” : tidyverse and ggplot2
- Very easy to manipulate tables (select columns, create new variables)
- High quality graphics
- Work environment
- R studio
- Document your data processing
- R markdown
- Create HTML, pdf, presentations
- Share your data and workflow
- GitHub
What can you do with R ?
- Science
- Statistics of course…
- Data processing
- Graphics
- Time series analyses
- Maps
- Bioinformatics
- But also
- Teach
- Do a presentation
- Write your CV
- Build a web site
- Write a book
- Much more…
What can you do with R ?
Example of web page
:::
Yahoo channel - A must

Help
Cheat sheets
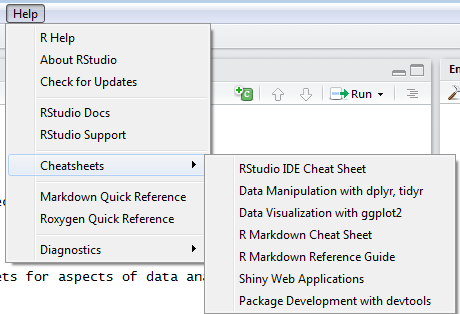
Let’s get started
The R studio interface
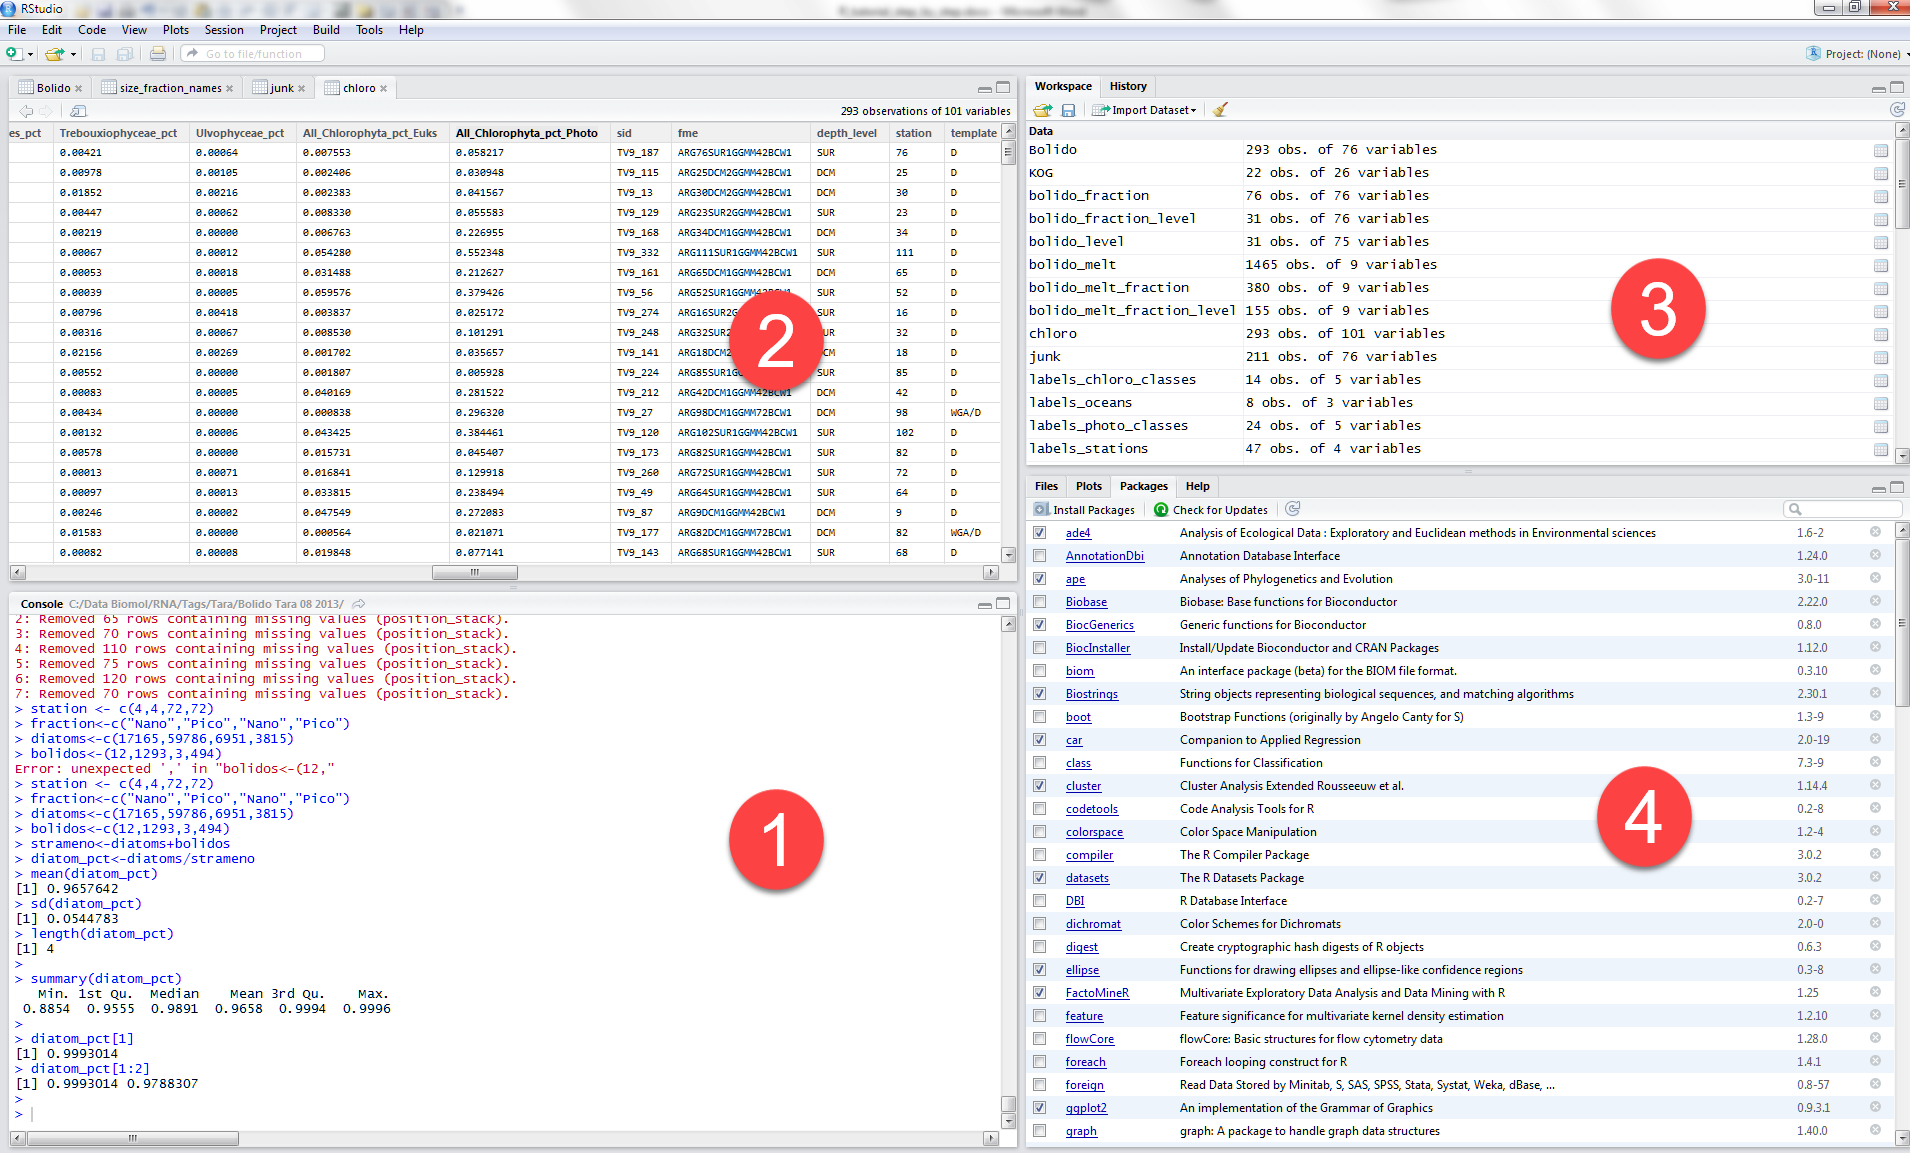
- Bottom left
- Console
- Top left
- File editor for .R and .Rmd files
- Data frame visualization
- Top right
- Environment (i.e. R objects)
- History
- Bottom right
- Files
- Plots
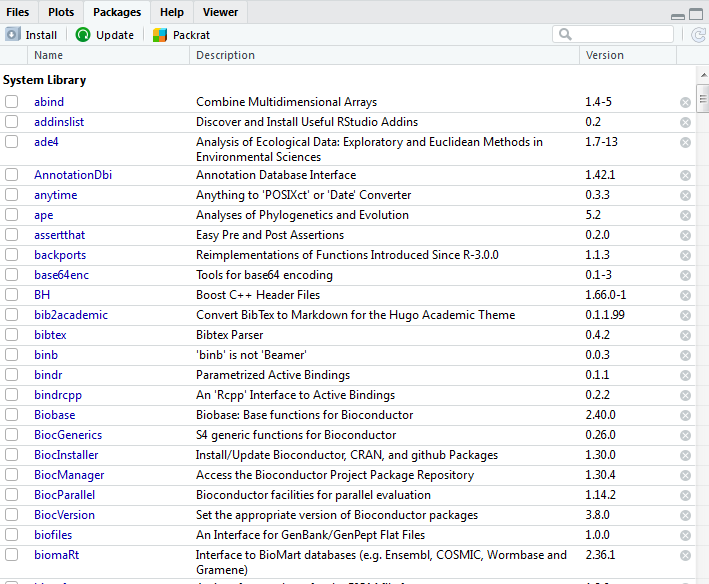
- Packages
- Help
Create a new project
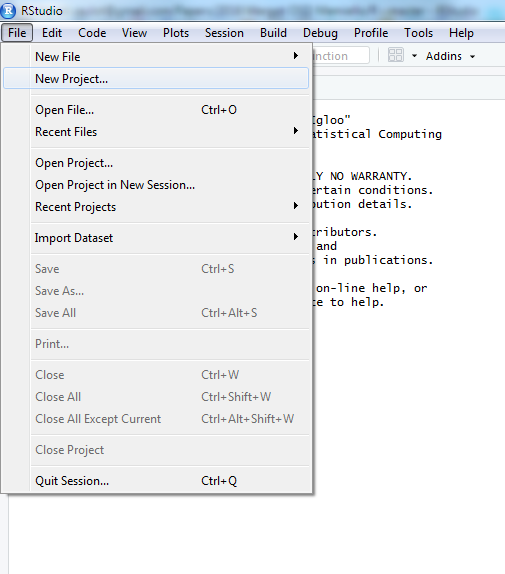
- Open R studio
- Create new project for the course in a new directory
- e.g.
Microbes course
- e.g.
Your first script
Two ways to proceed
- Type directly in command window
[1] "Hello world"- Create a new script
Type in script window
* Select and execute (CTRL-R)
* Source the script
R objects
Variables
Variables are abstracting your data.
Variables are objects
- Create a variable
[1] "Hello world"Assignement
- Assignement done with <-
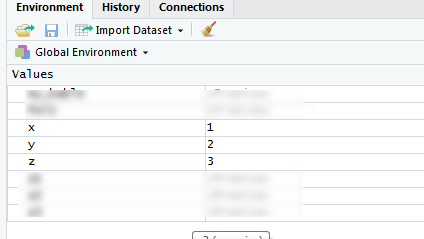
[1] 3Visualizing objects
You can view the values of the objects in R-studio environment window (top-right)
R is case sensitive
[1] 3Rules for naming objects
- Use
- letters
- numbers
- the dot
- the underscore (not the minus sign !)
- Start always with a letter
Myvariable,Myvariable1,Myvariable.1,Myvariable_01are OK1Myvariable,My-variable,Myvariable@are not OK
Rules for naming objects
- Use consistent naming: five conventions
- alllowercase: e.g. adjustcolor
- period.separated: e.g. plot.new
- underscore_separated: e.g. numeric_version
- lowerCamelCase: e.g. addTaskCallback
- UpperCamelCase: e.g. SignatureMethod
- Prefer third one, much more easy to read
- Use names for objects : last_name
- Use verbs for function : build_name
- Think about best order
- e.g. prefer maybe name_last because then you can have name_first, name_full…
- and you identify that all these objects are related to a name…
Data types
character: “Daniel”, “This is a course in R”, ‘Joe Biden’
numeric: 2, 15.5, 10e-3
integer: 2L (the L tells R to store this is an integer)
date: 2018-02-25
logical: TRUE, FALSE
complex: 1+4i (complex numbers with real and imaginary parts)
No data “NA”
Not a number “NaN” (e.g. division by zero)
Data structures
Vector
List
Matrix
Data frames
Function
Vectors
Vectors
- The basic R structure is a vector (think as a column in Excel):
\[\begin{bmatrix}10 \\ 20 \\ 30 \end{bmatrix}\]
- A vector can contain only a single element
\[\begin{bmatrix}10 \end{bmatrix}\]
Vectors
- Assign several elements
[1] 10 20 30Access specific elements of a vector
- First
[1] 10Determine object properties
Apply functions (we will come back to functions latter)
- typeof() - what is the object’s data type (low-level)?
- length() - how long is it? What about two dimensional objects?
[1] "integer"
[1] 21
What is the type and length of PoTU ?
Operators
Arithmetic Operators
| Operator | Description | |
|---|---|---|
| + | addition | |
| - | subtraction | |
| * | multiplication | |
| / | division | |
| ^ or ** | exponentiation | |
| x %% y | modulus (x mod y) 5%%2 is 1 | |
| x %/% y | integer division 5%/%2 is 2 |
We are performing vector operations !
\[\begin{bmatrix} 1\\2\\3\\..\end{bmatrix}+\begin{bmatrix}1\\2\\3\\..\end{bmatrix}=\begin{bmatrix}2\\4\\6\\..\end{bmatrix}\]
Think about it as adding 2 columns in Excel.
Arithmetic Operators
- Vector one element
[1] 3- Vector several elements
[1] 2 4 6 8 10 12 14 16 18- Several instructions on same line separated by ;
- The hastag # indicate a comment -> Use heavily to document your code
- However, it is even better to use R markdown (we will see it later)
Use the other operators
Arithmetic Operators
- What happens when the vectors have different number of elements ?
[1] 2 3 4 5 6 7 8 9 10Can we add logical ?
[1] 1No error but…
The resulting variable is transformed to a numeric
How you would show that ?
Logical Operators
| Operator | Description | |
|---|---|---|
| < | less than | |
| <= | less than or equal to | |
| > | greater than | |
| >= | greater than or equal to | |
| == | exactly equal to | |
| != | not equal to | |
| !x | Not x | |
| x | y | x OR y | |
| x & y | x AND y | |
| isTRUE(x) | test if X is TRUE |
Logical Operators
Do not mix
- == which is logical operator
- = which is assignement
Can we add characters ?
Error in first + last: argument non numérique pour un opérateur binaireGenerates an error
What can we do ?
Functions
Functions
Functions perform specific task on objects
- e.g. to concatanate strings we use paste()
Getting what you want
Let’s apply paste :
[1] "Jo Biden"- We would like to get “Jo_Biden”
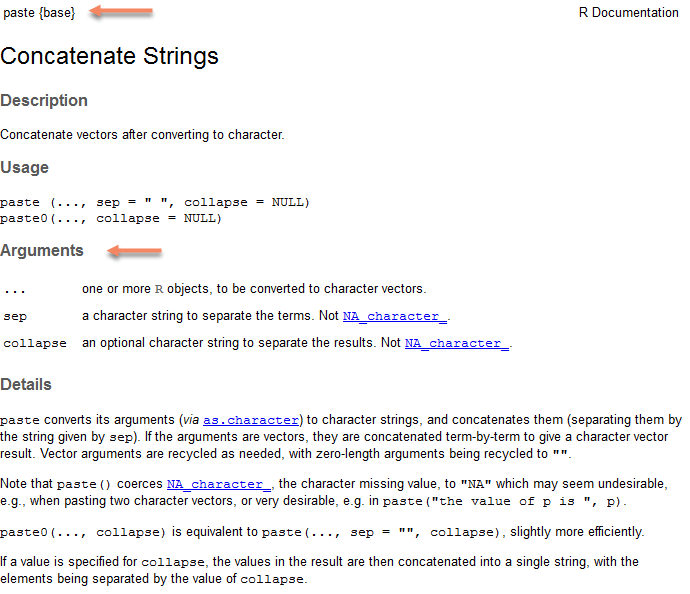
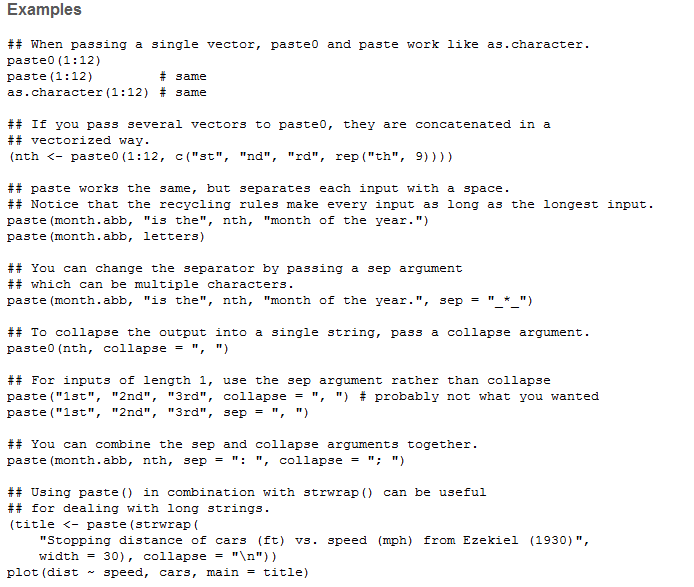
Can you read the help and suggest a change in the way we call the function ?
Write your own function
If you write 3 times the same piece of code, then write a function…
- my_sum : function name
- a, b : arguments
- instructions are enclosed by braces ({})
- return() : the value(s) returned
Call your function
[1] 30Write a function to compute a product
Examples of functions
Most of the time you do not have to write functions because someone has already written one for what you want to do…
- Sum
[1] 5050Statistics
[1] -0.5113399
[1] 1.336385Plot
- Histogram
What is this “library()”
Packages
Packages
Packages are set of functions that have a common goal.
They are really the strength of R
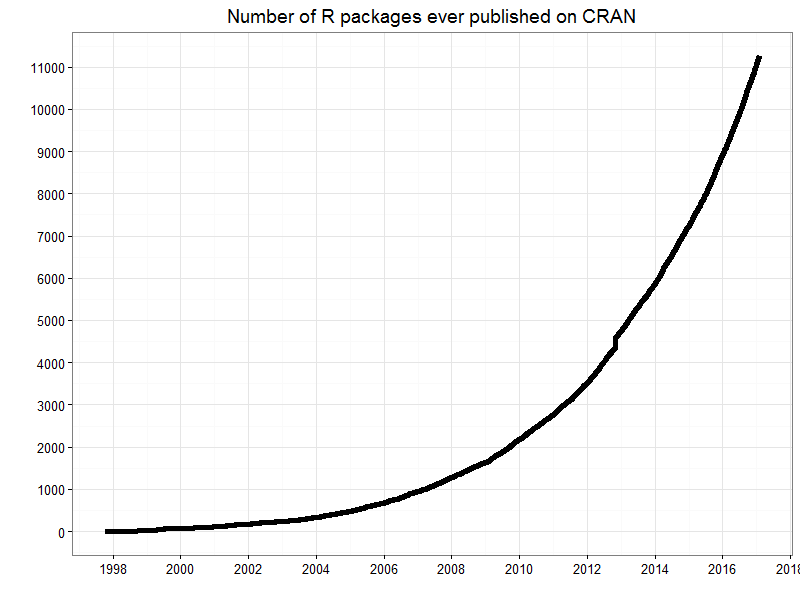
- And these are only the “official”” packages. You can find more on GitHub
Installing a package
Download on your computer the package you need
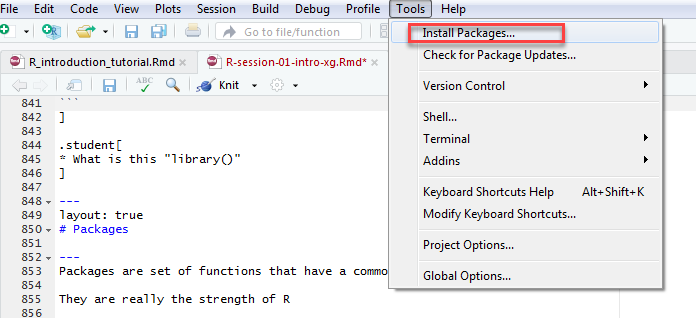
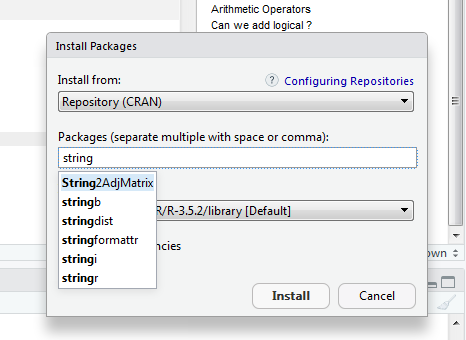
Install package stringr (to manipulate strings of characters)
Using a package
To use functions from the package
- use the syntax
package::function
[1] "Jo Biden"OR
- load the package with the library function
[1] "Jo Biden"Sometimes functions from different libraries have similar names
List installed packages
Recap
- R is case sensitive: Z != z
- Objects: data types vs data structures
- Vectors: think in vector operations
- Operators: arithmetic vs. logical
- Functions: try to practice
Next: 02 - Data wrangling
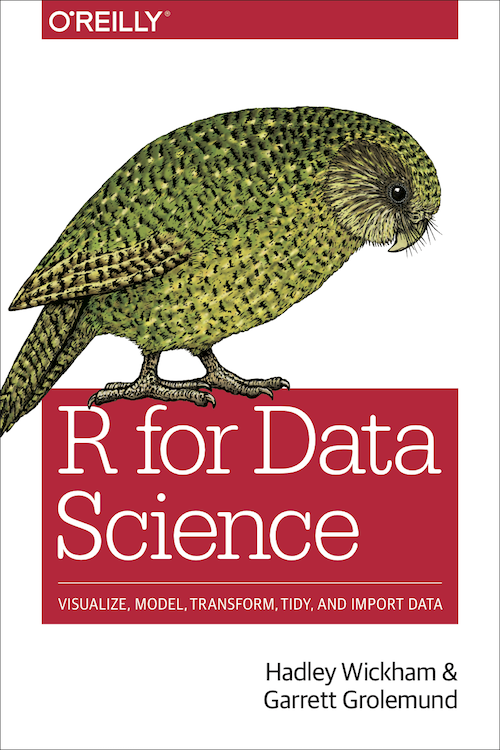
- Data frames
- Concept of tidy data
- Reading data
- Manipulating data
- Selecting columns
- Selecting rows
R - Introduction

