Daniel Vaulot
![]()
![]()
![]()
Phytoplankton biogeography - metaPR2
Metabarcoding
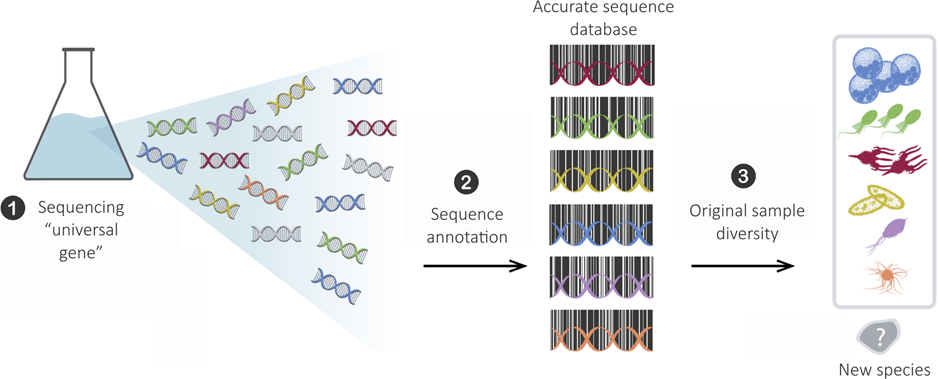
Many metabarcoding studies for eukaryotes
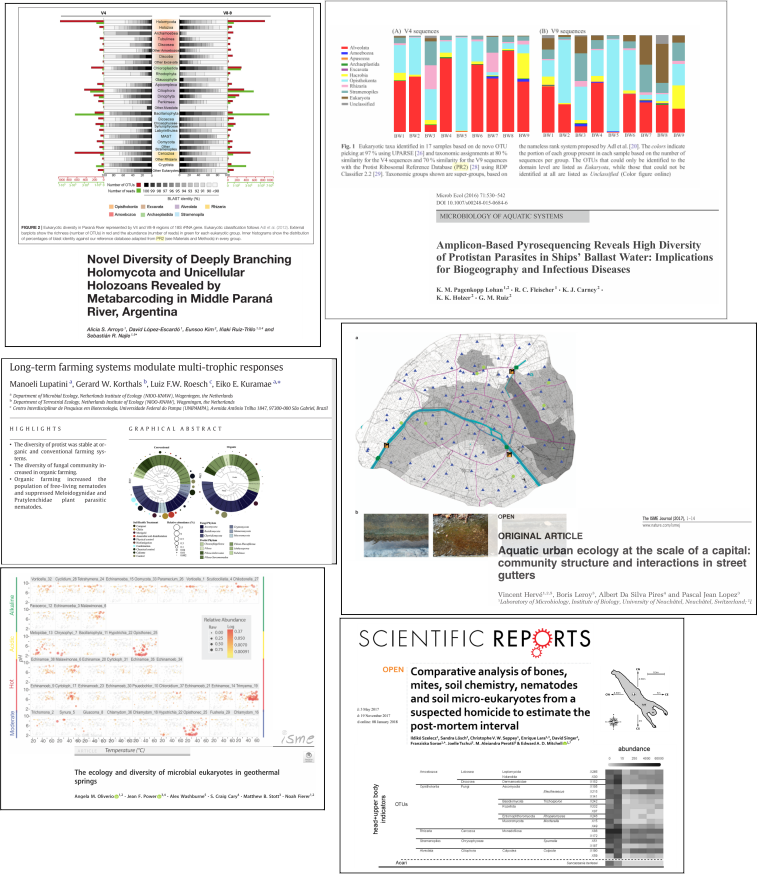
But hard to use…
- Processed with different pipelines
- Different primers
- Different levels of similarity
- Different reference databases
- Metadata lacking
Large datasets
- Ocean Sampling Day
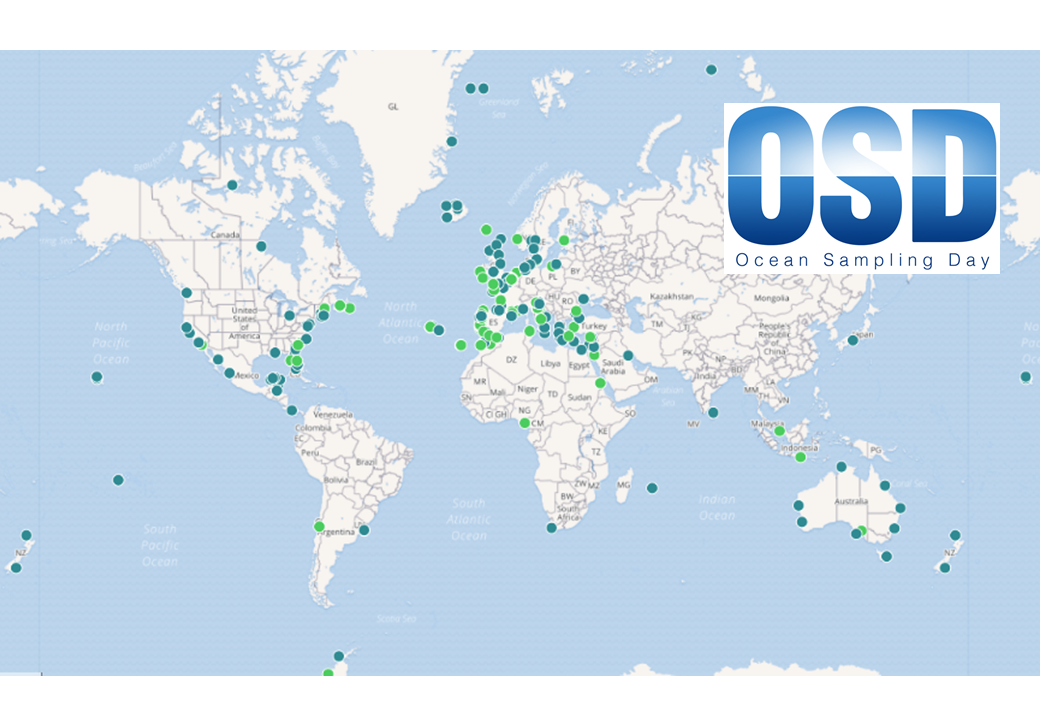
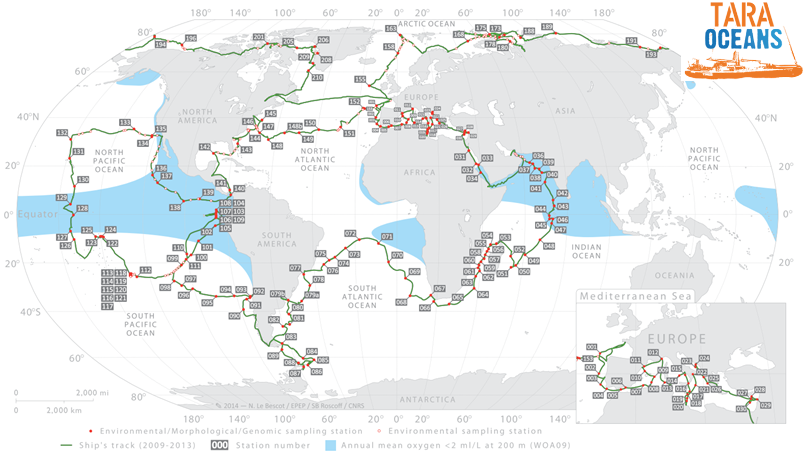
- Tara Oceans
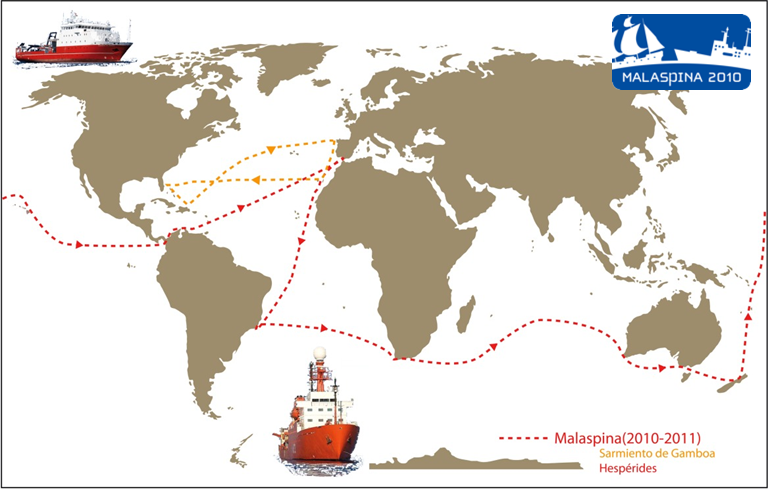
- Malaspina
metaPR2 a database of metabarcodes
Reprocess public data
- Download Genbank (SRA) data
- Raw sequences
- Metadata
- Reprocess
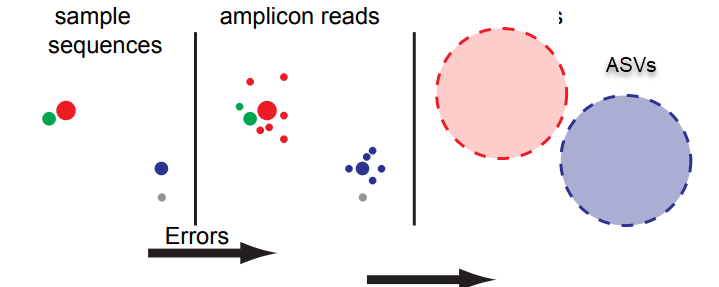
- Amplicon Sequence Variant (dada2)
- Merge ASVs with same sequence
- Store in MySQL database
- Develop under R
- Web interface and R package
- https://app.metapr2.org
Current status
- Version 2.1
- Datasets: 59
- Samples: 6,202
- Barcodes (ASVs): 93,127
Factors affecting protist communities
Environmental conditions
In oceanic waters:
- temperature
- salinity
- light
- nutrients
… which depend on:
- substrate (water vs.ice)
- latitude
- time of the year
- depth
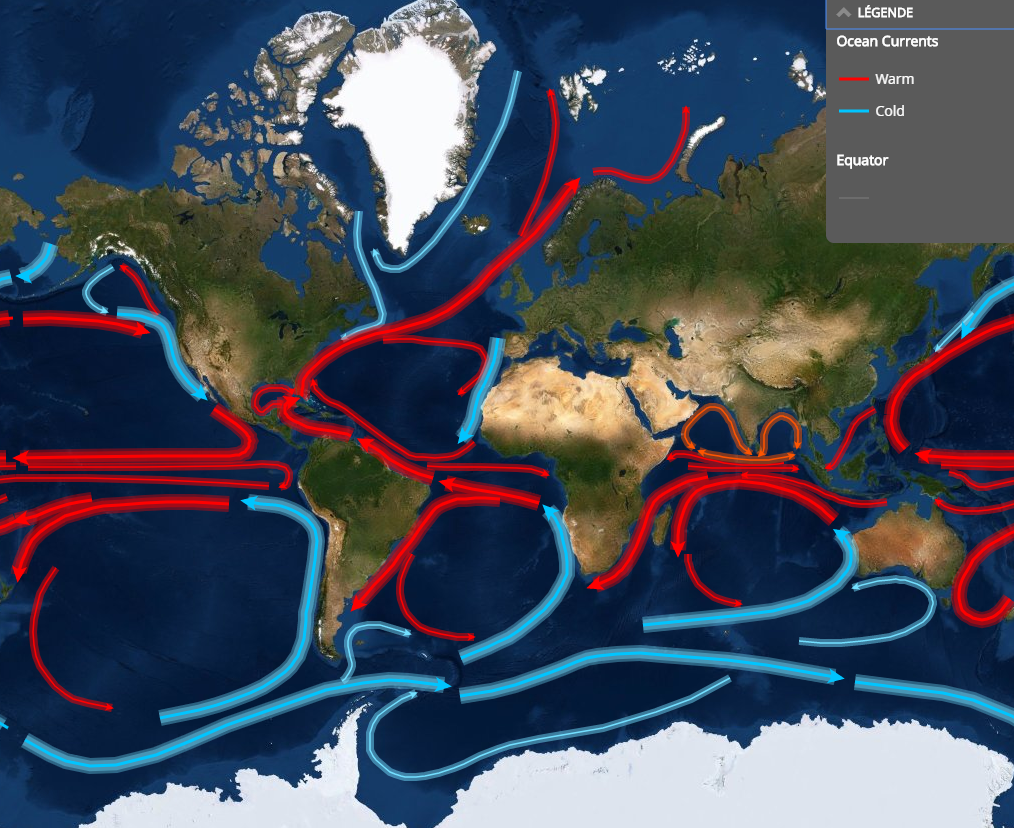
- oceanic currents
- proximity of coast
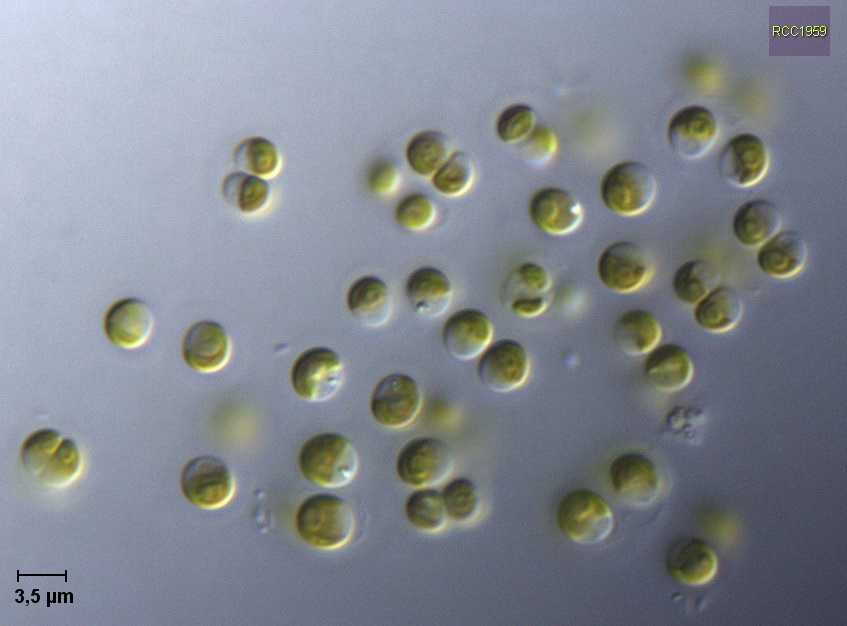
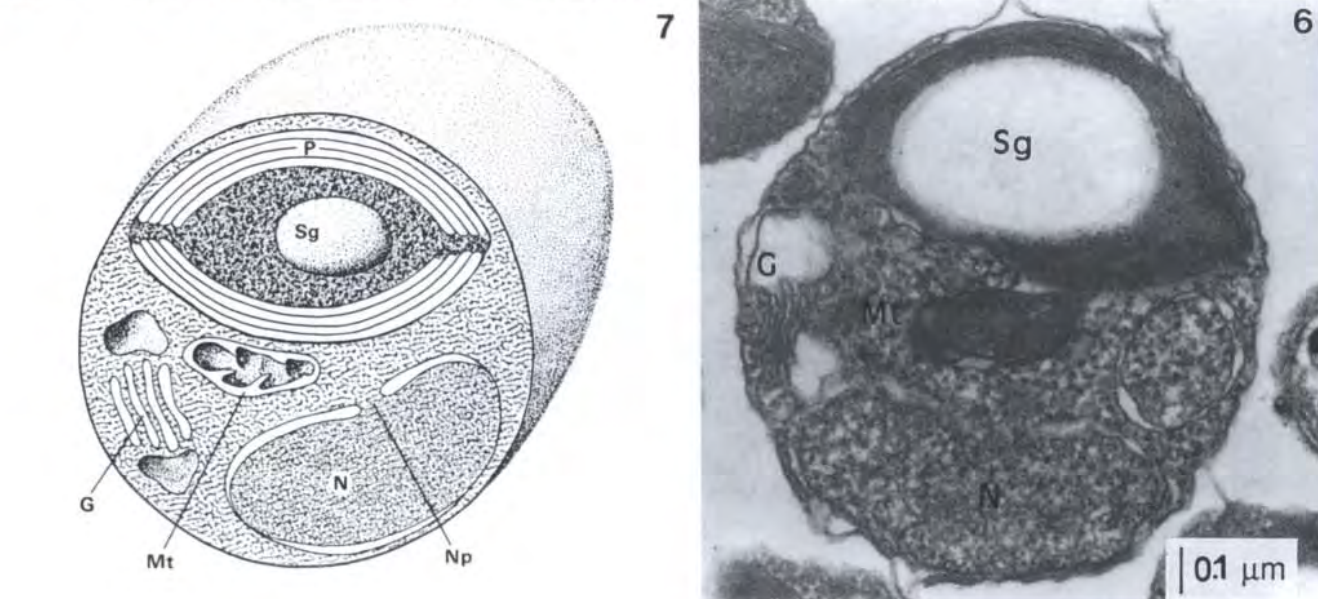
Example: Biogeography of Micromonas

Example: Biogeography of Ostreococcus

Overview
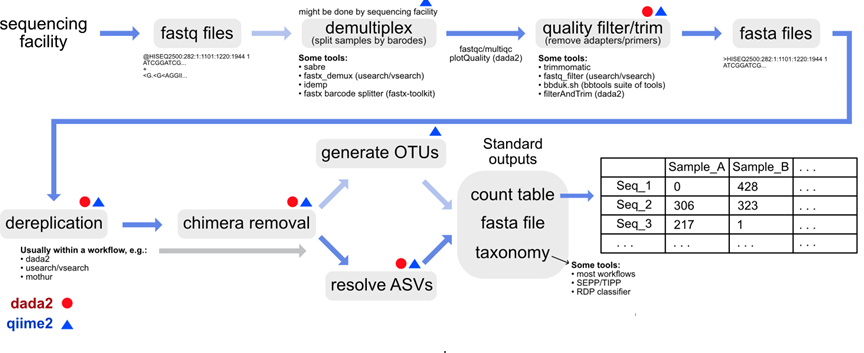
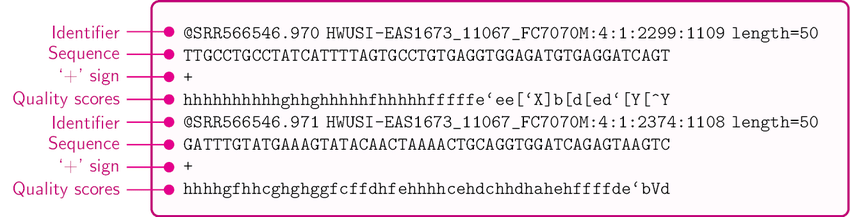
Sequences
Fastq files
Cluster
Assign
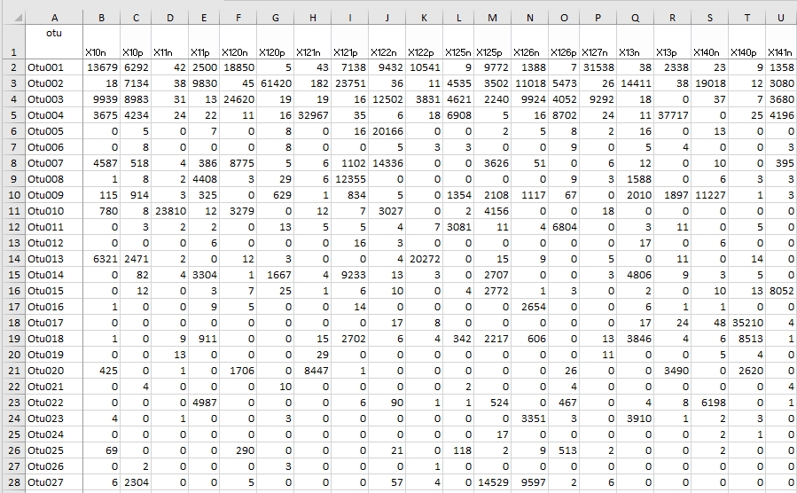
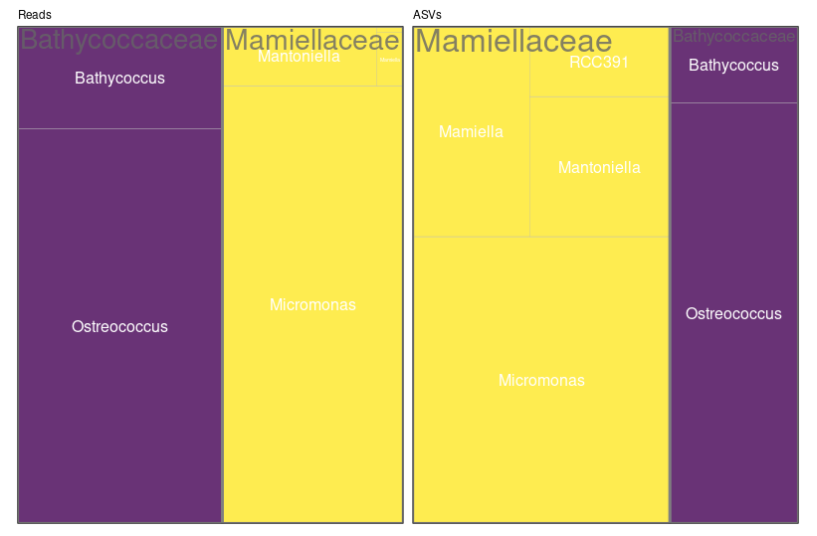
Output - ASVs
Output - Abundance
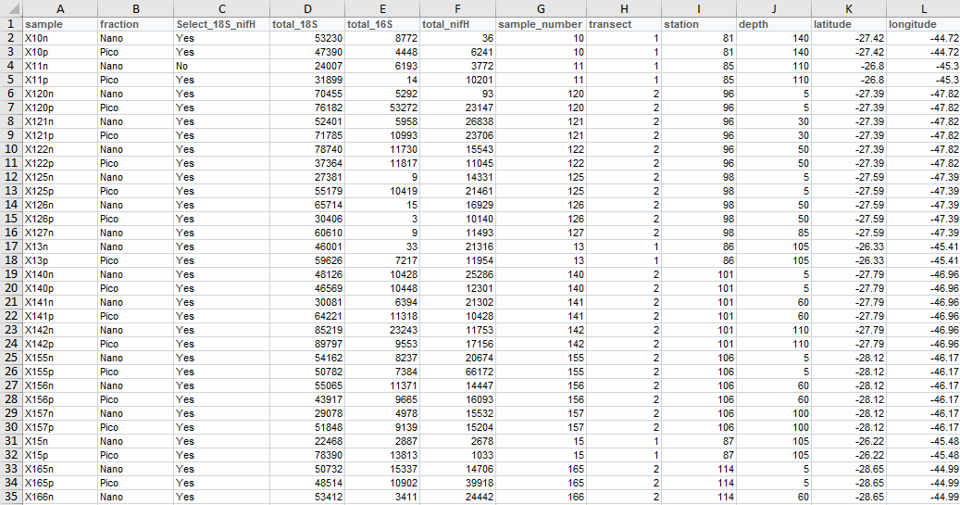
Output - Metadata
Output- Merged
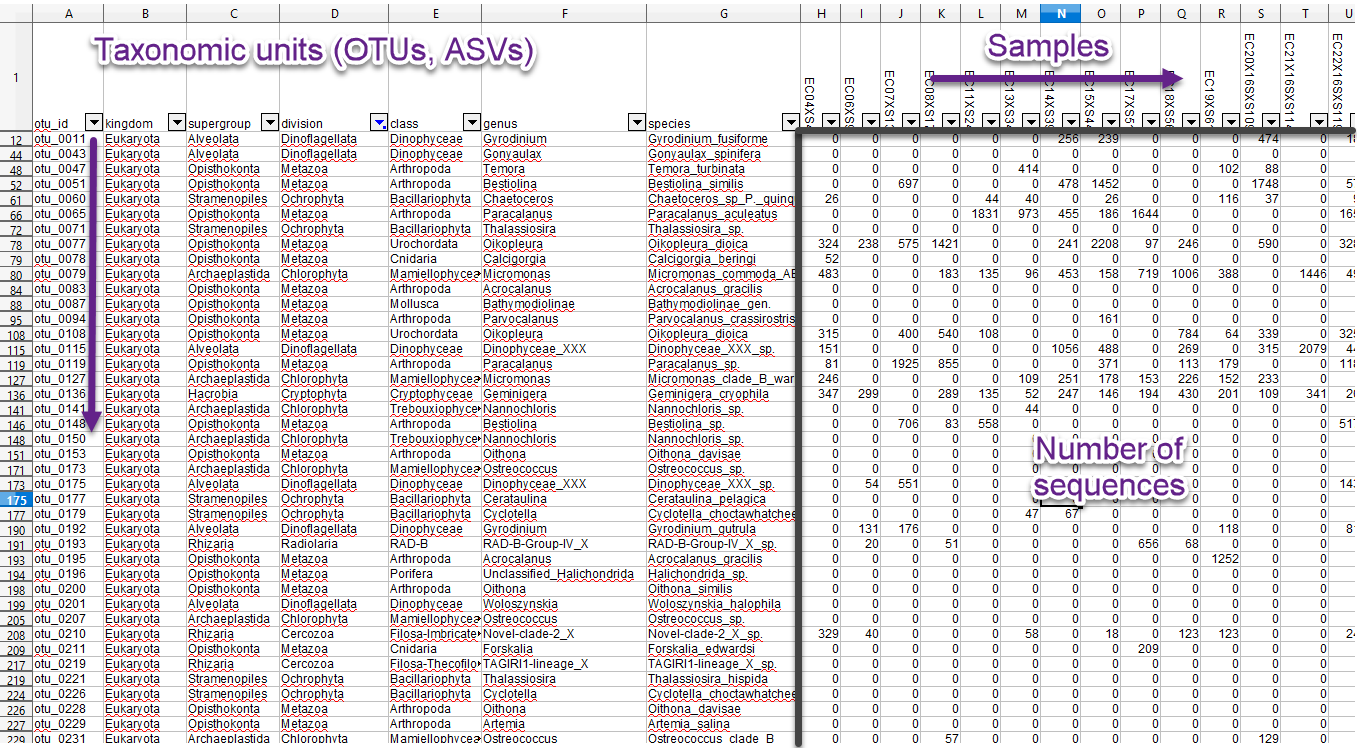
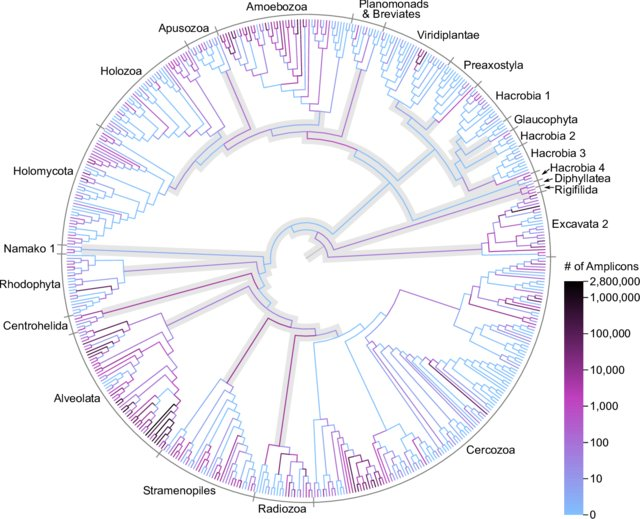
MetaPR2 - Taxonomy
Nine levels:
- Domain: Eukaryota
- Supergroup: Archaeplastida
- Division: Chlorophyta
- Subdivision: Chlorophyta_X
- Class: Mamiellophyceae
- Order: Mamielliales
- Family: Bathycoccaceae
- Genus: Bathycococcus
- Species: B. prasinos
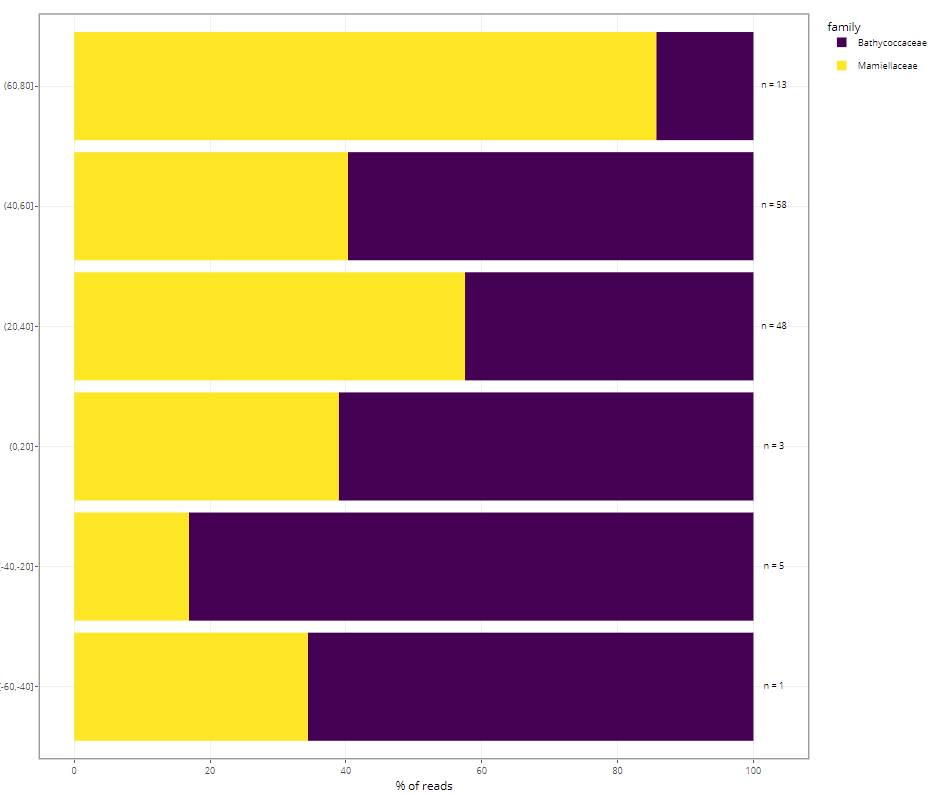
Barplots - Latiude
Barplots - Time series

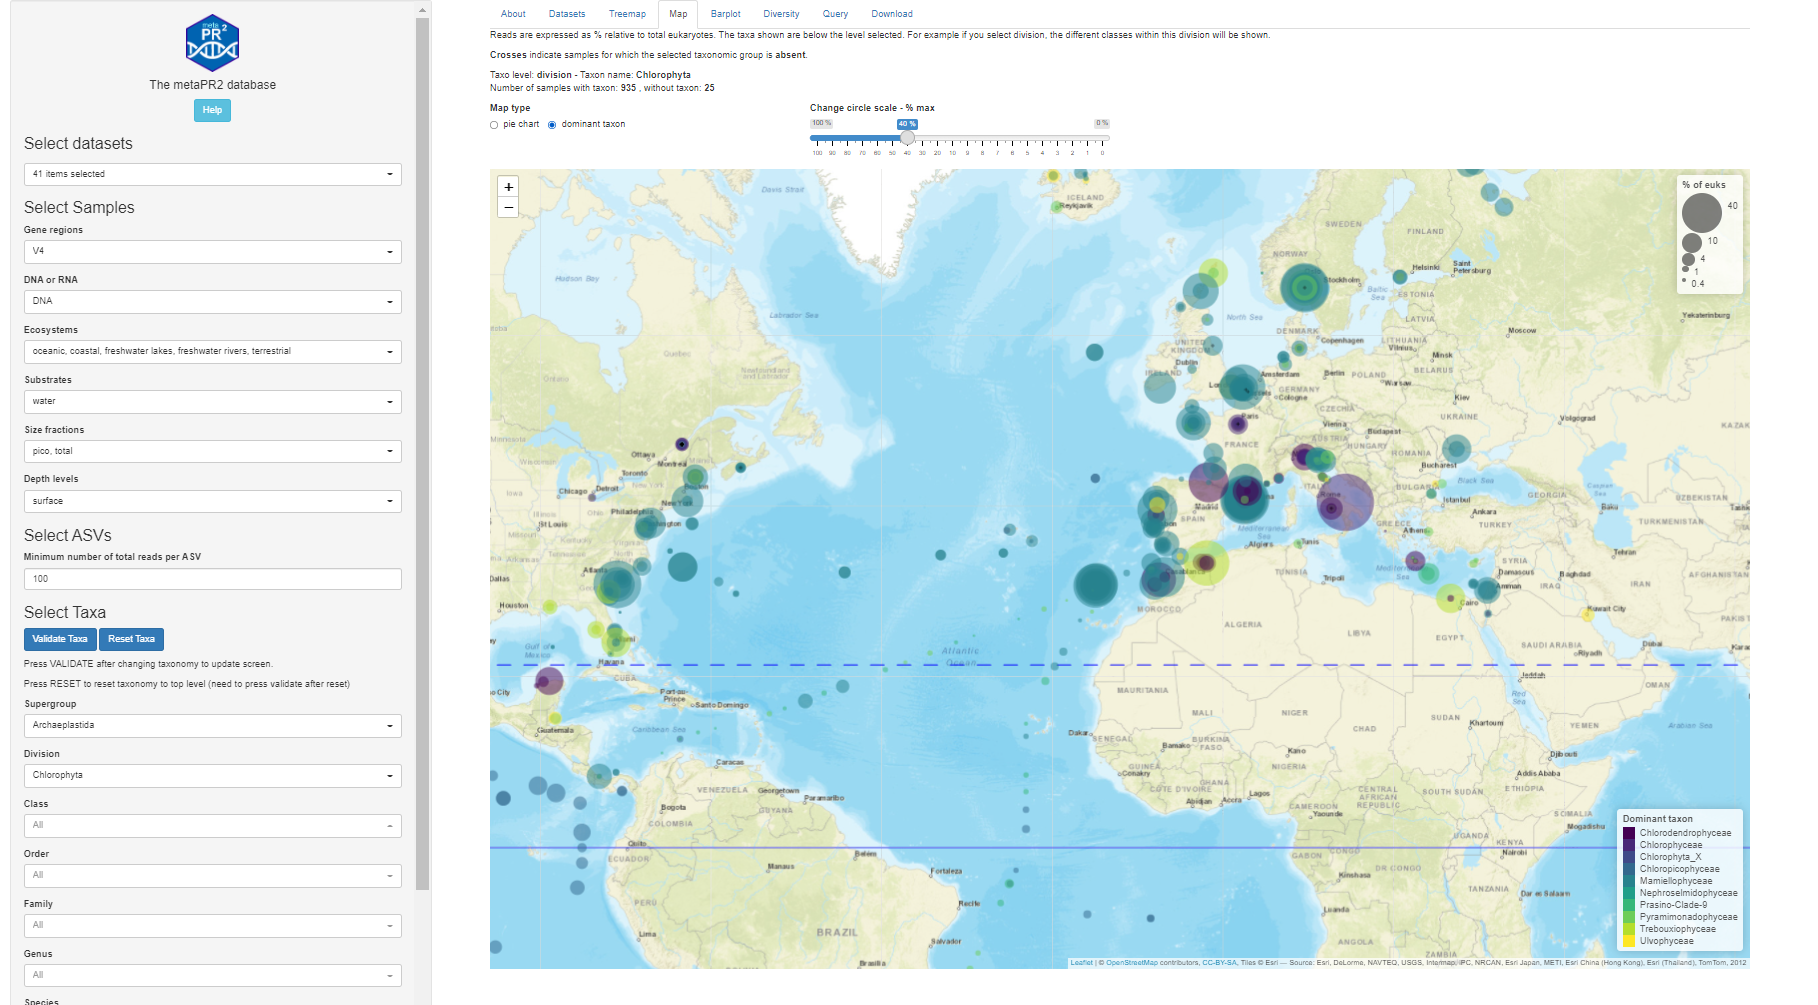
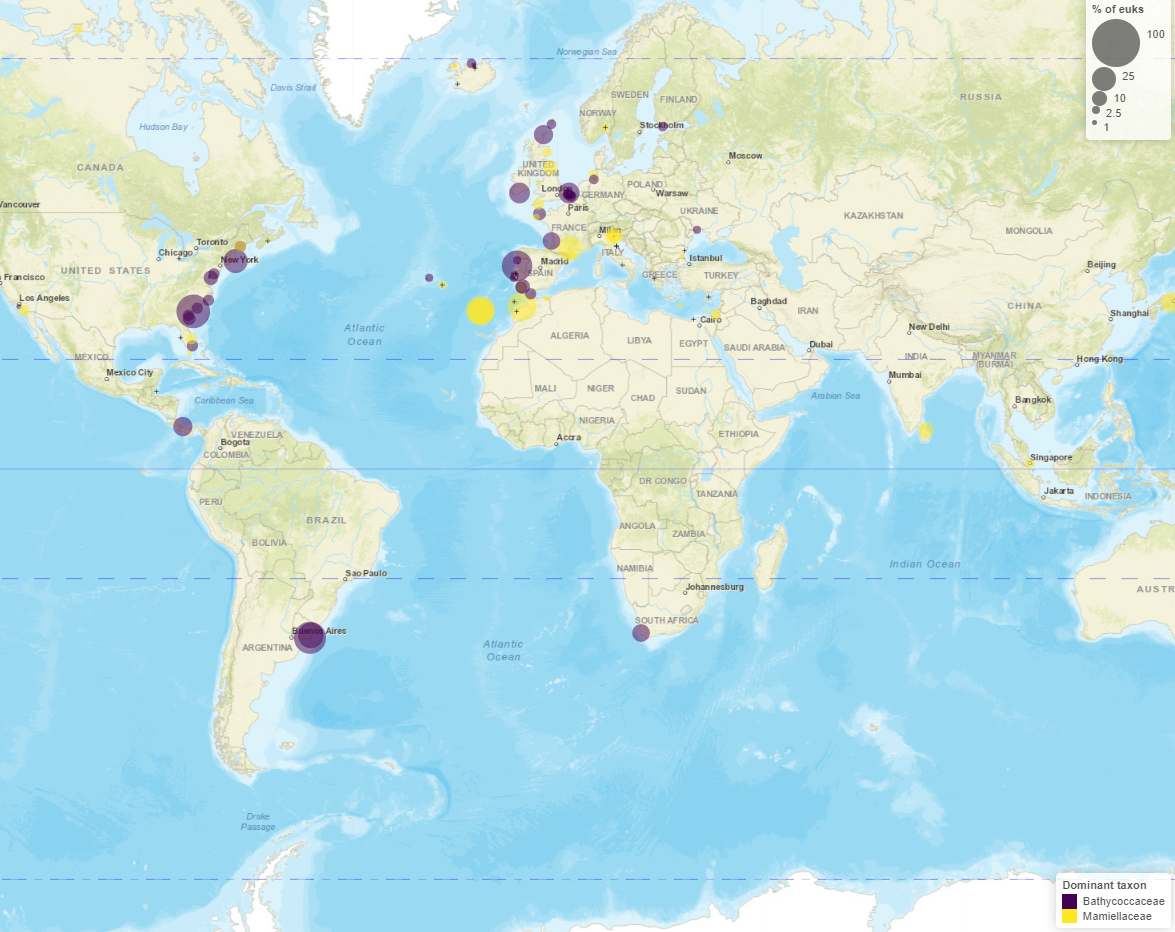
Maps - Dominant
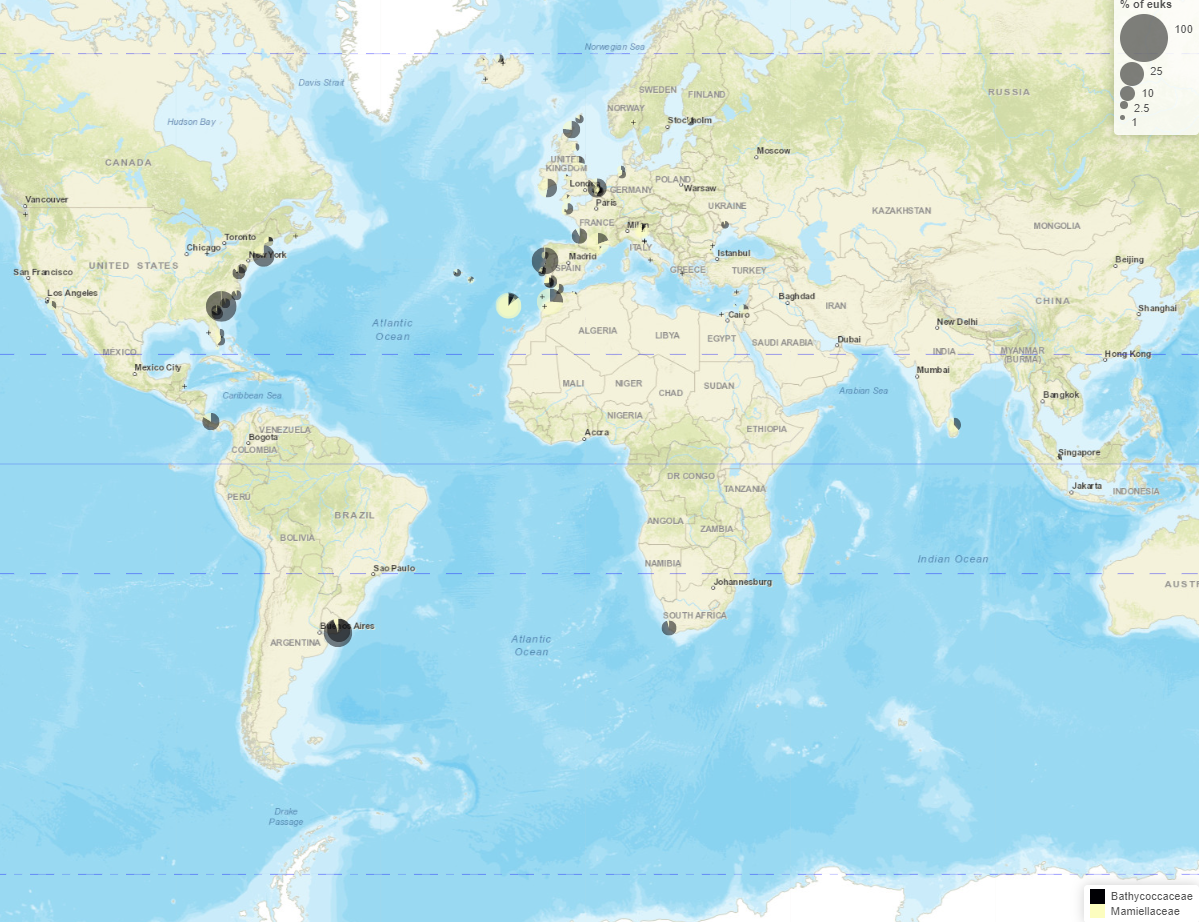
Maps - Pie charts
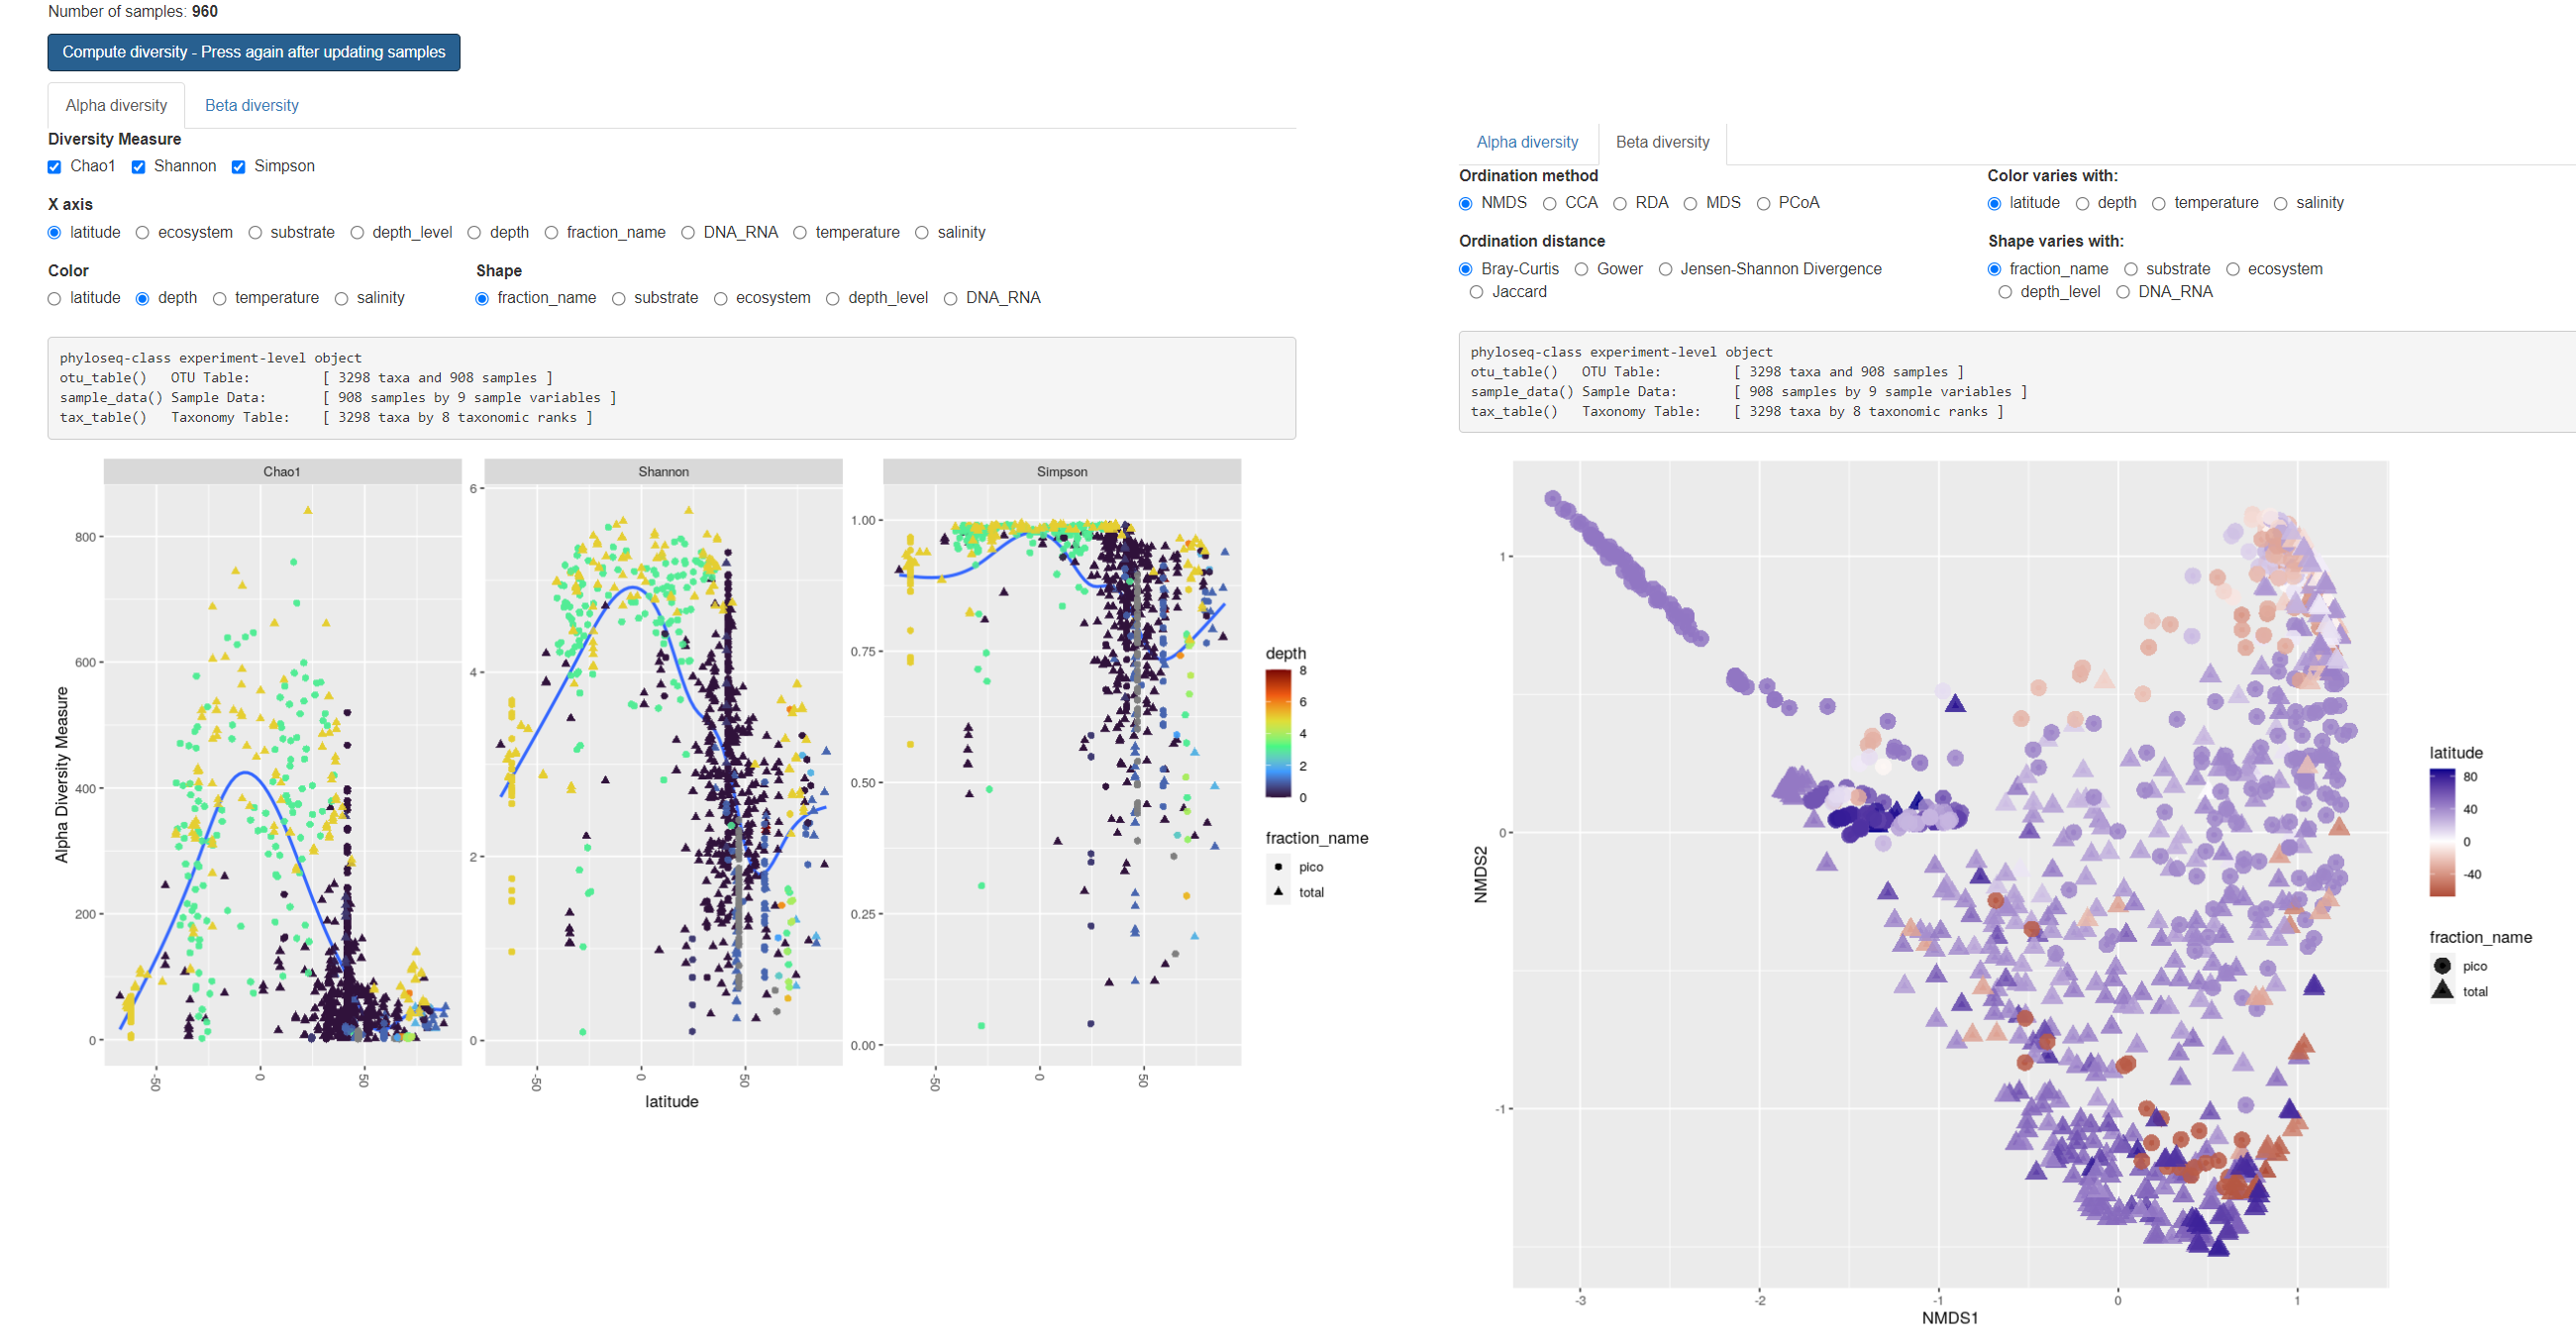
Diversity
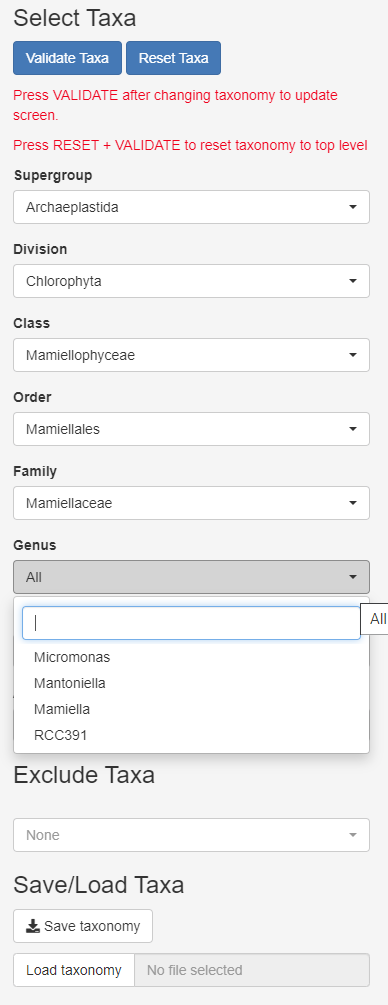
Taxonomy
- Can select several taxa within one level
- Press validate every time you need to refresh
- Can exclude taxa to remove fungi, metazoa…
- Can save taxonomy and reload taxonomy (yaml file)
Green algae
- Prasinoderma
- Ostreococcus
Ochrophyta (Stramenopiles)
- Pelagomonas, Aureococcus
- Florenciella
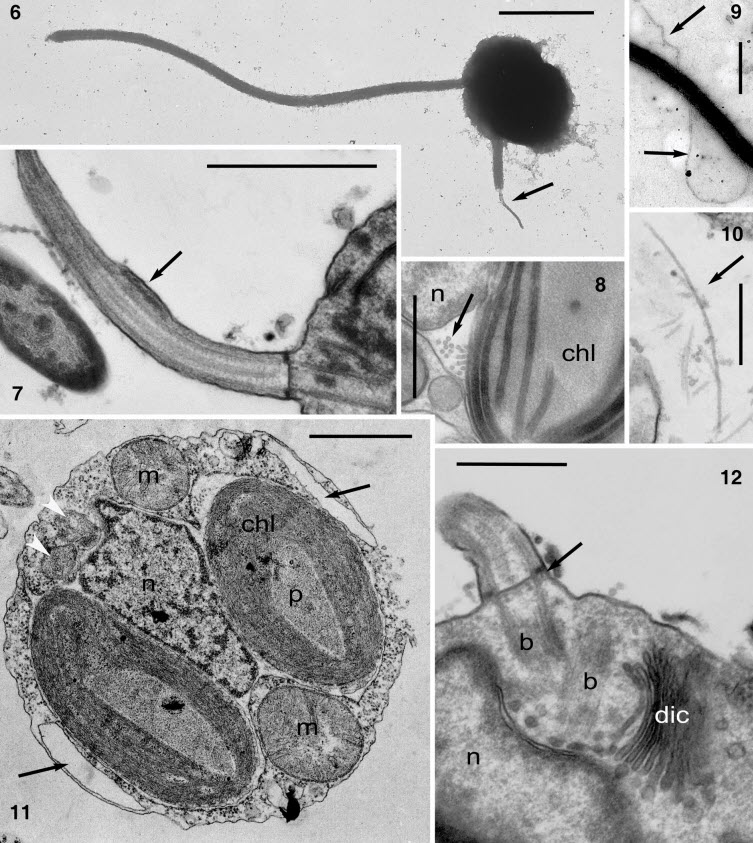
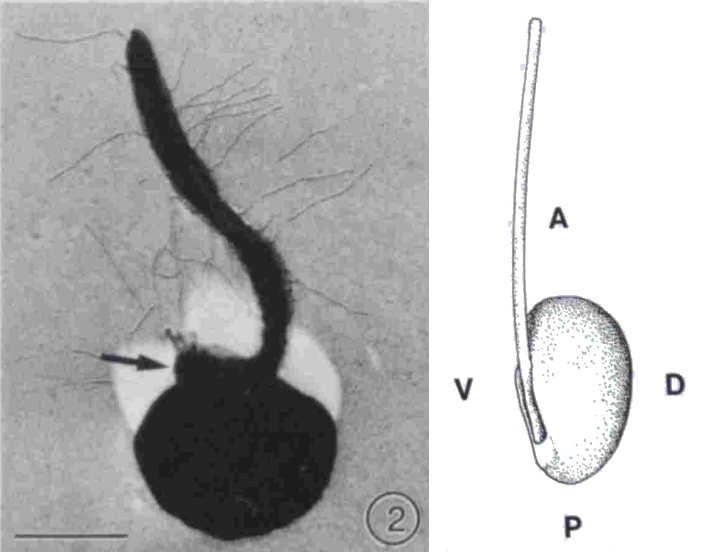
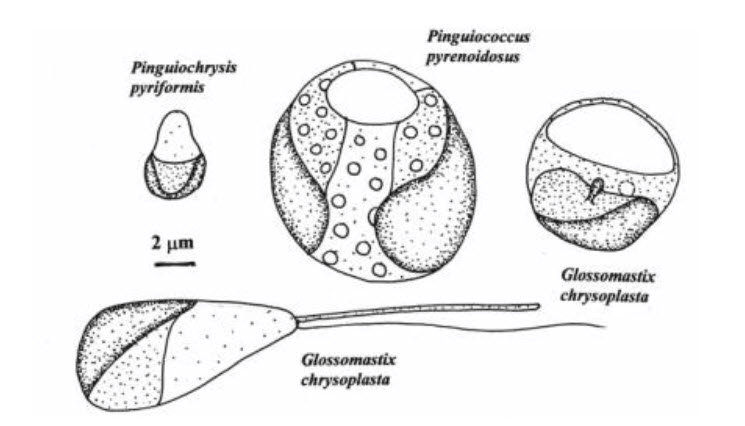
- Pinguiophyceae
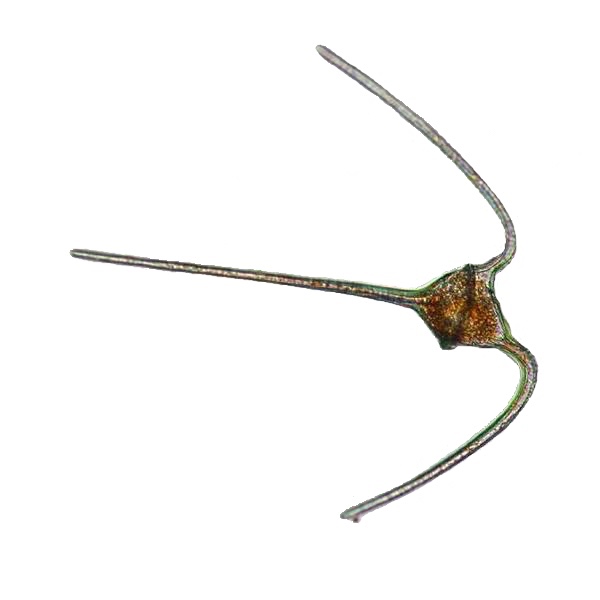
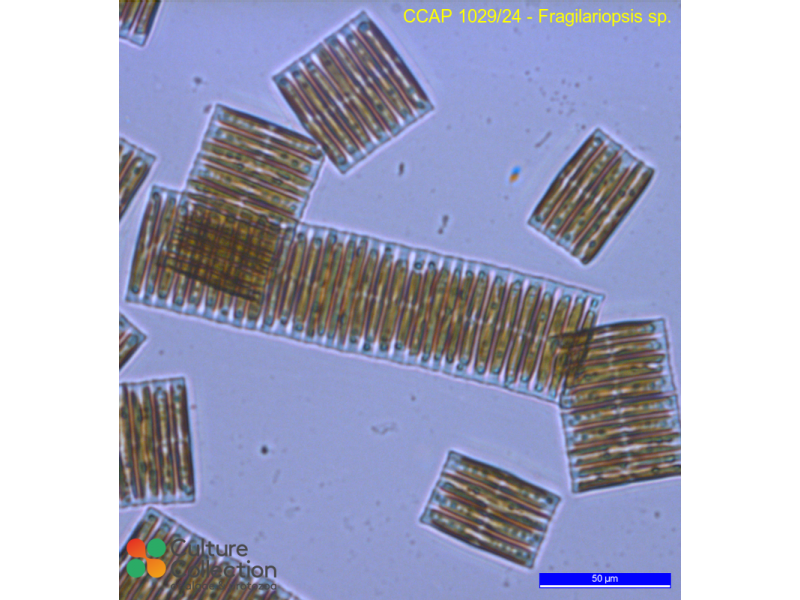
Diatoms
- Pseudo-nitzschia
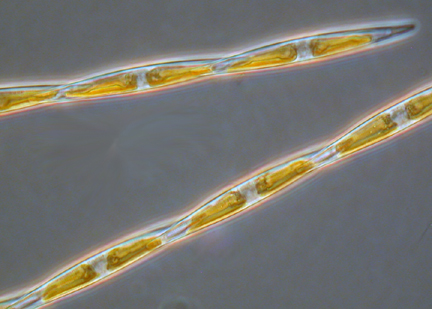
- Fragiliaropsis
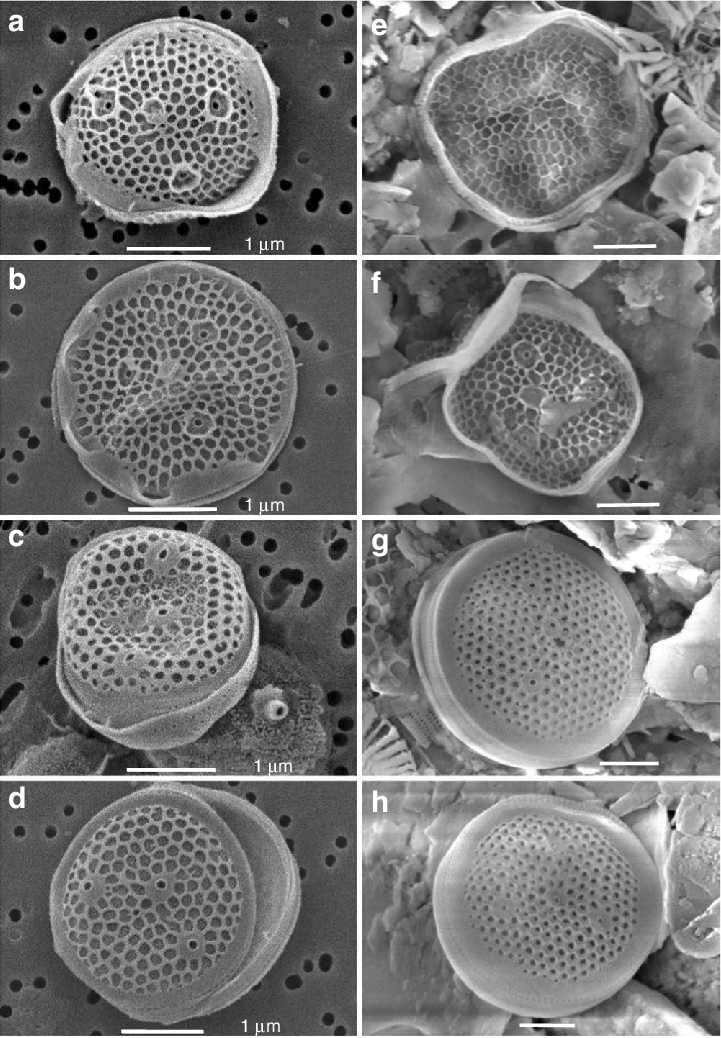
- Minidiscus
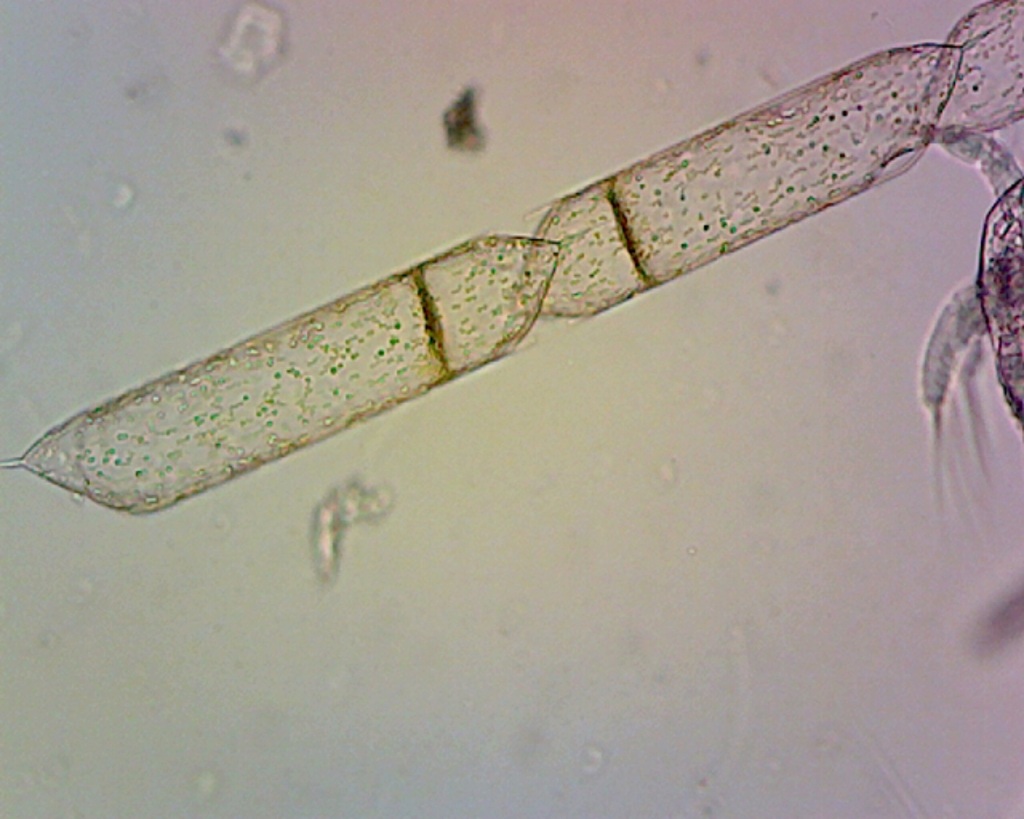
- Rhizosolenia
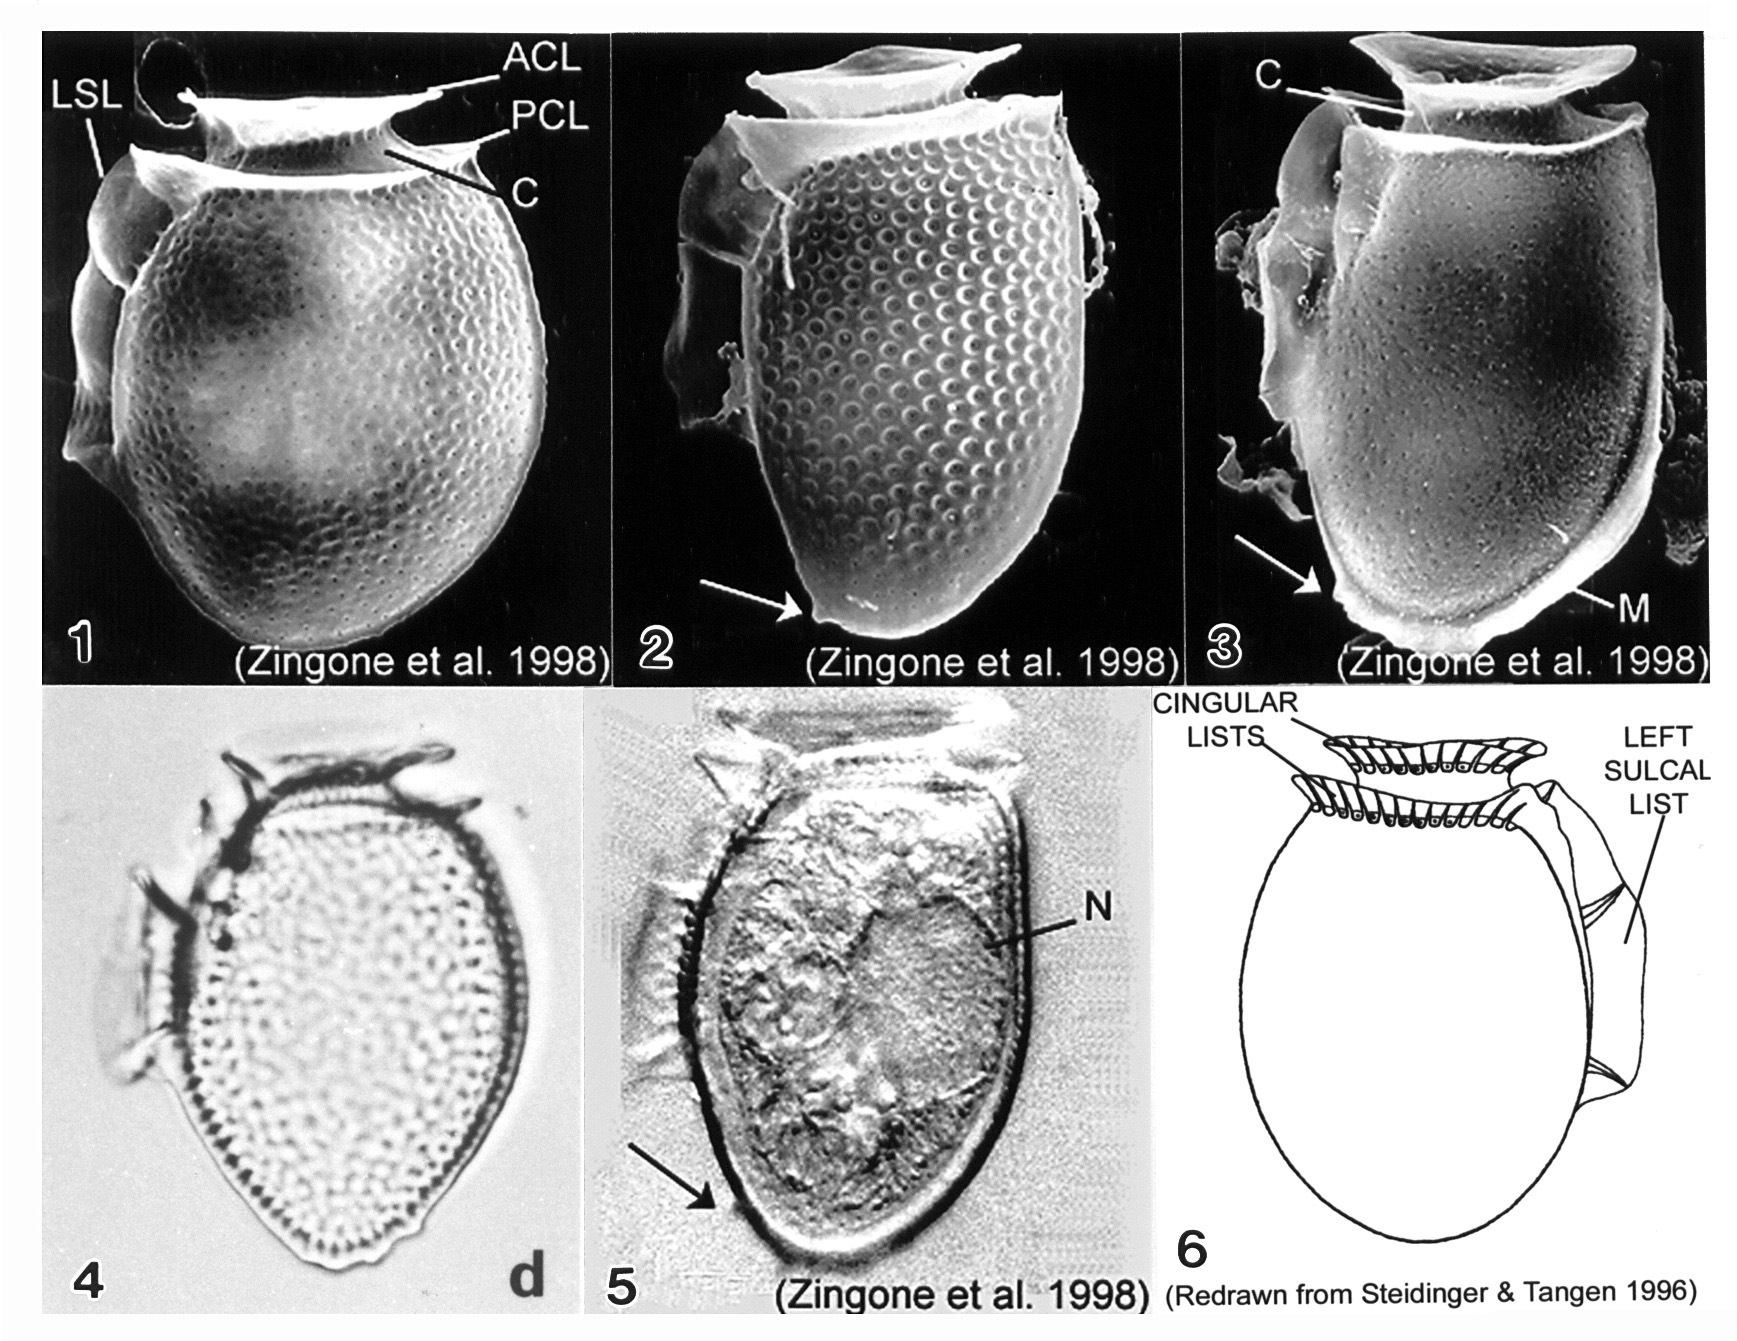
Dinoflagellates
- Dinophysis
- Ceratium, Tripos